Python: Yearly Forest Loss
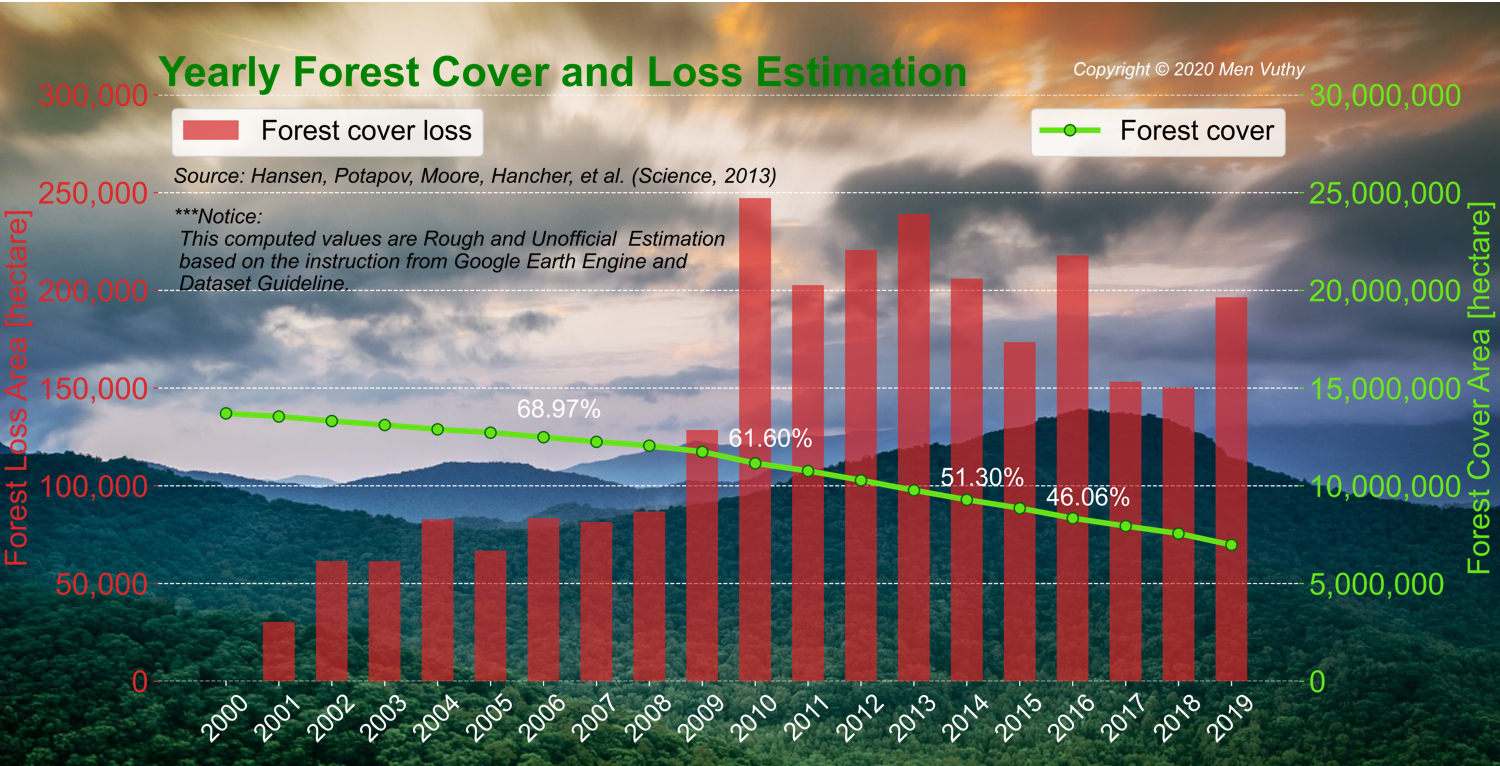
Here I will show how to plot bar chart with line graph to show the yearly forest loss in Cambodia with the code written in Python Jupiter Notebook.
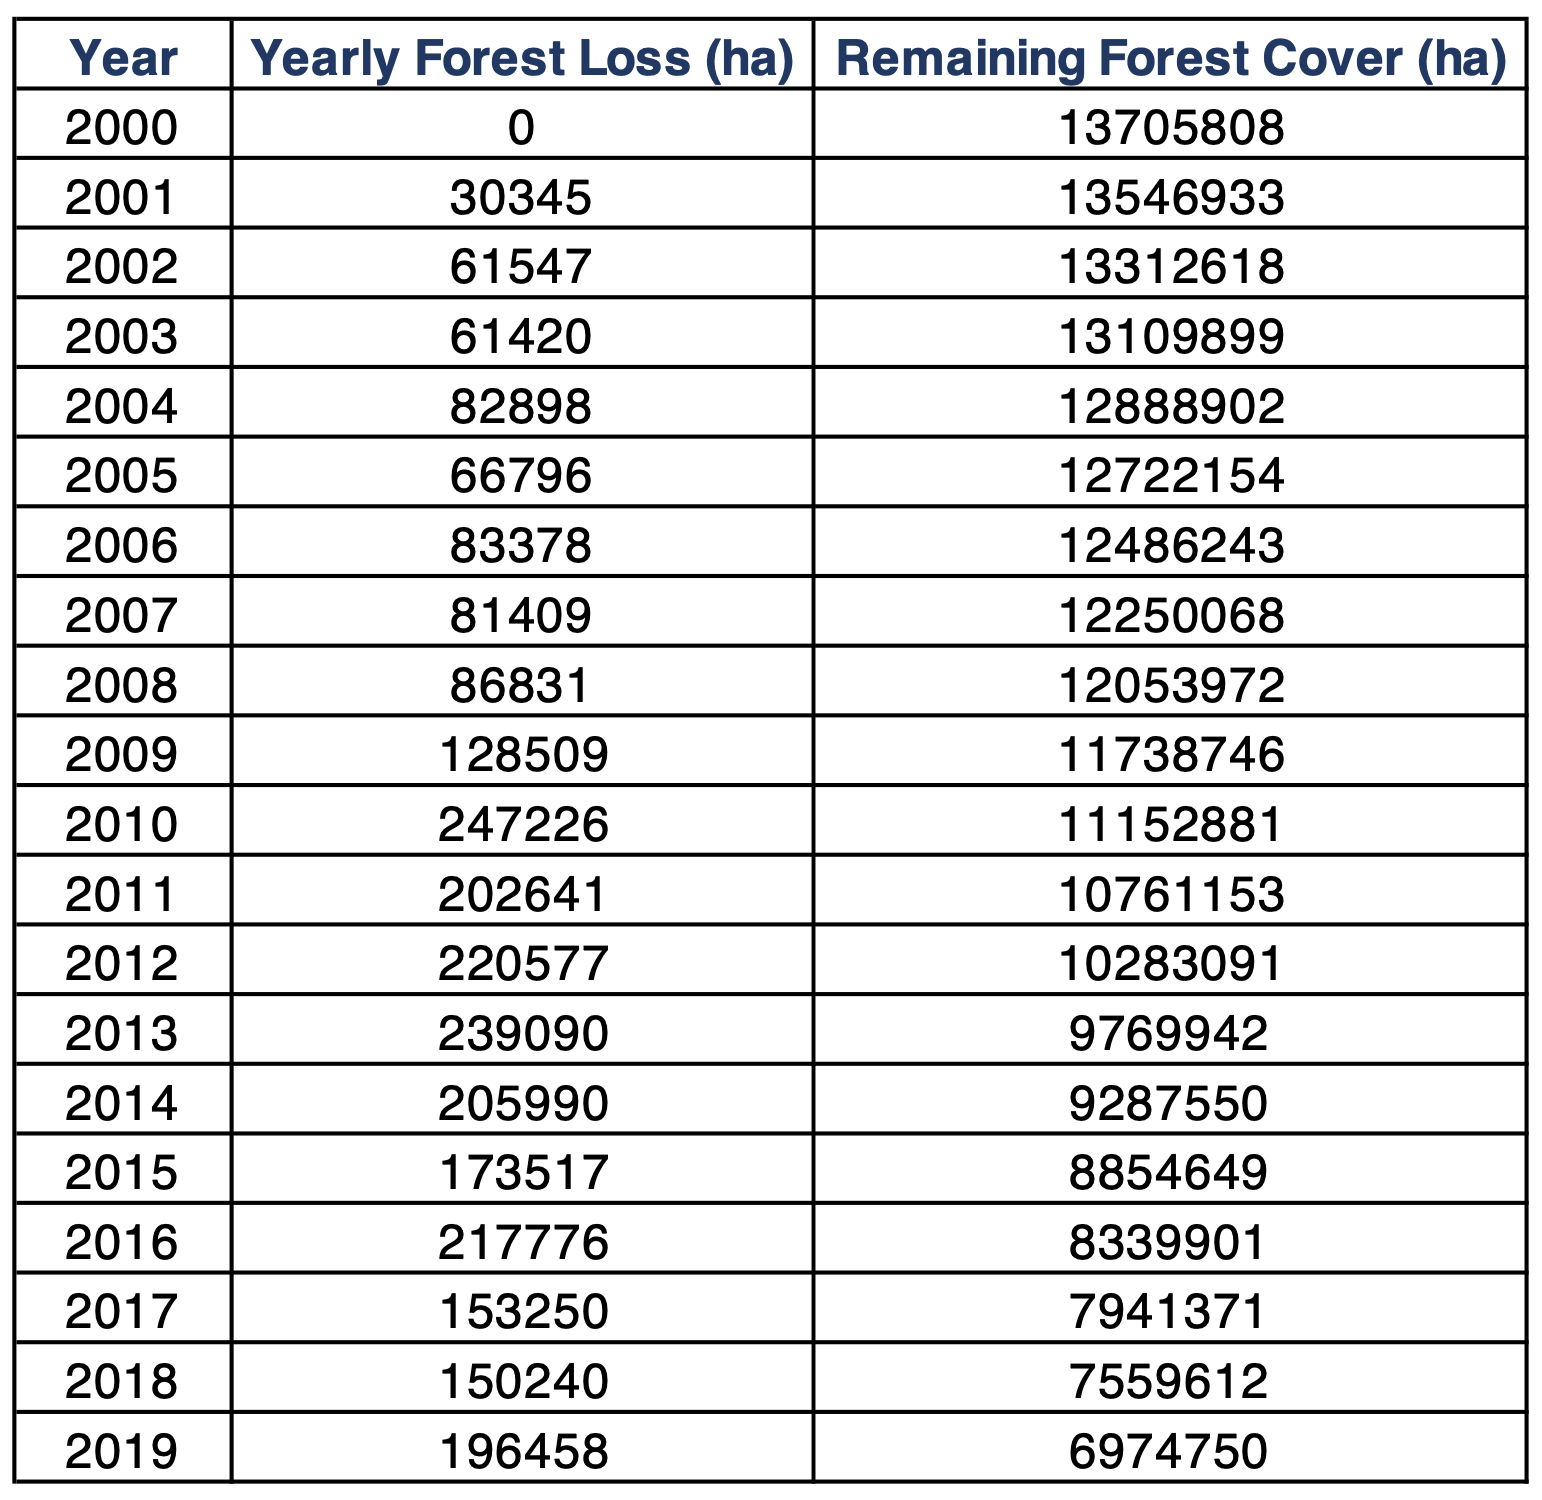
1. Data Table
Data source name: yearly-loss.csv

2. Code
---
import matplotlib.pyplot as plt
import numpy as np
import pandas as pd
from matplotlib import rc
import matplotlib as mpl
# set font type
plt.rcParams["font.family"] = "Arial"


# import data table
df = pd.read_csv('yearly_loss.csv')
# assign values
year = df.iloc[:,0]
yloss = df.iloc[:,1]
x = np.arange(len(year))
ycover = df.iloc[:,3]

# create plot
fig = plt.figure(figsize=(15,7),constrained_layout=True)
bar_width = 0.6
plt.rc('xtick', labelsize=18, color = 'black')

plt.rc('axes', labelsize=22)


plt.rcParams['ytick.right'] = plt.rcParams['ytick.labelright'] = False
plt.rcParams['ytick.left'] = plt.rcParams['ytick.labelleft'] = True

ax = fig.add_subplot()
plt.grid(which='major',linestyle='--', axis = 'y')
ax.bar(x, yloss,width = bar_width, color = 'tab:red', label = 'Forest cover loss',
        alpha=0.7, zorder = 2)
plt.xticks(x, year, rotation = 45)
plt.legend(loc = 'upper left', fontsize = 20)
plt.ylabel('Forest Loss Area [hectare]', color = 'tab:red')
ax.yaxis.set_major_formatter(mpl.ticker.StrMethodFormatter('{x:,.0f}'))
plt.ylim(0,300000)
plt.box(False)
plt.text(-1,255000,'Source: Hansen, Potapov, Moore, Hancher, et al. (Science, 2013)', style='italic', fontsize = 15, color = 'black')
plt.text(-1, 200000, '***Notice: \n This computed values are Rough and Unofficial  Estimation \n based on the instruction from Google Earth Engine and \n Dataset Guideline.',
         style='italic', fontsize = 15, color = 'black')
plt.text(16,310000,'Copyright © 2020 Men Vuthy', style='italic', fontsize = 13, color = 'white')
plt.rc('ytick', labelsize=22, color = '#66E019')

ax2 = ax.twinx()
ax2.plot(x, ycover, color = '#66E019', linestyle = '-', linewidth = 4, marker='o', markersize=8, markeredgecolor = 'darkgreen', label = "Forest cover")
ax2.get_yaxis().get_major_formatter().set_scientific(False)
ax2.yaxis.set_major_formatter(mpl.ticker.StrMethodFormatter('{x:,.0f}'))
plt.ylim(0,30000000)
plt.ylabel('Forest Cover Area [hectare]', color = '#66E019')
plt.legend(loc = 'upper right', fontsize = 20)
plt.title('Yearly Forest Cover and Loss Estimation', fontsize = 30, loc = 'left', fontweight = 'bold', color = 'green')
plt.rc('ytick', labelsize=22, color = 'tab:red')
plt.box(True)
plt.text(5.5, 13500000, '68.97%', fontsize = 18, color = 'green')
plt.text(9.5, 12000000, '61.60%', fontsize = 18, color = 'green')
plt.text(13.5, 10000000, '51.30%', fontsize = 18, color = 'green')
plt.text(15.5, 9000000, '46.06%', fontsize = 18, color = 'green')


plt.savefig('yearly-loss.png', dpi = 300, transparent=False)
plt.show()
---
3. Plot

Source code is available at: GitHub


