Overview of iPoster at AGU Fall Meeting conference
Introduction
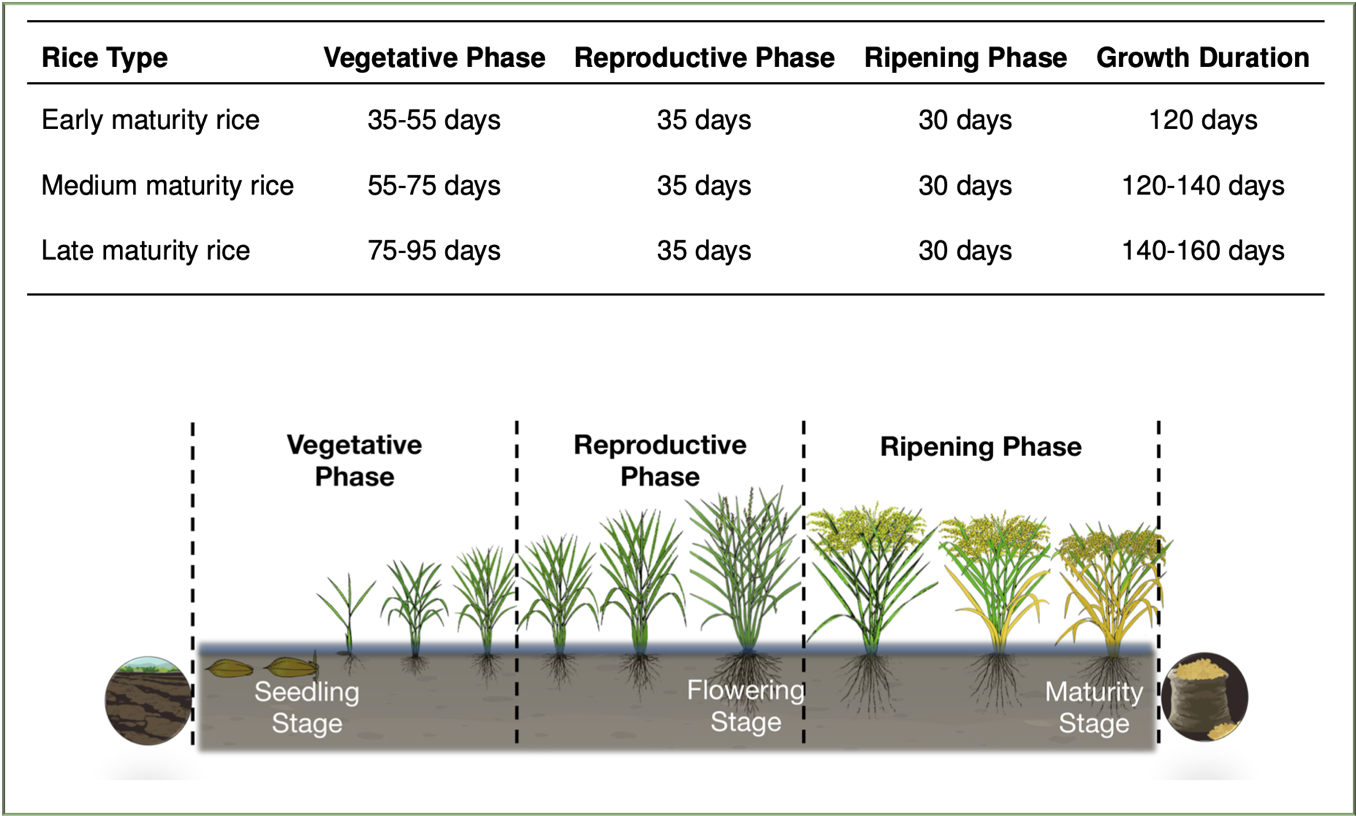
Rice crops are mainly categorized into early, medium and late variety, and they are differently damaged by flood depending on its growth characteristic, productivity, and value.
However, the estimation method of flood damage based on rice crop types remains unexamined in previous studies due to the shortage of past damage data and intensive field survey with local farmers, especially with those who experienced the past flood events.
Hence, this study attempts to:
- develop the assessment methodology to estimate the flood damage on early, medium and late rice crops based on flood depth and flood duration through development of:
- Three Types of Flood Depth-duration and damage Curves (3-Type FDCs) according to field survey with farmers in the flood-affected area.
- paddy area map of early, medium and late rice crop by using MODIS satellite imagery.
- Assess the flood damage on rice crops under the past and the present cropping patterns and analyze the impact of different flood frequencies.
- Assess the flood damage on rice crops under the present climate (1979-2003) and future climate (2075-2099) conditions, based on MRI-AGCM3.2S precipitation datasets from previous study [2].
This study enriches more understanding on how early, medium and late rice crops are damaged by floodwater with the function of flood depth and flood duration. The assessment method can be applied in other areas; mainly, in the area with scarce data. It also provides essential information about the areas of risk which can be useful for future development activities; particularly, for establishing a flood mitigation policy and strategy for climate change adaptation.
Study area and field survey
1. Study Area
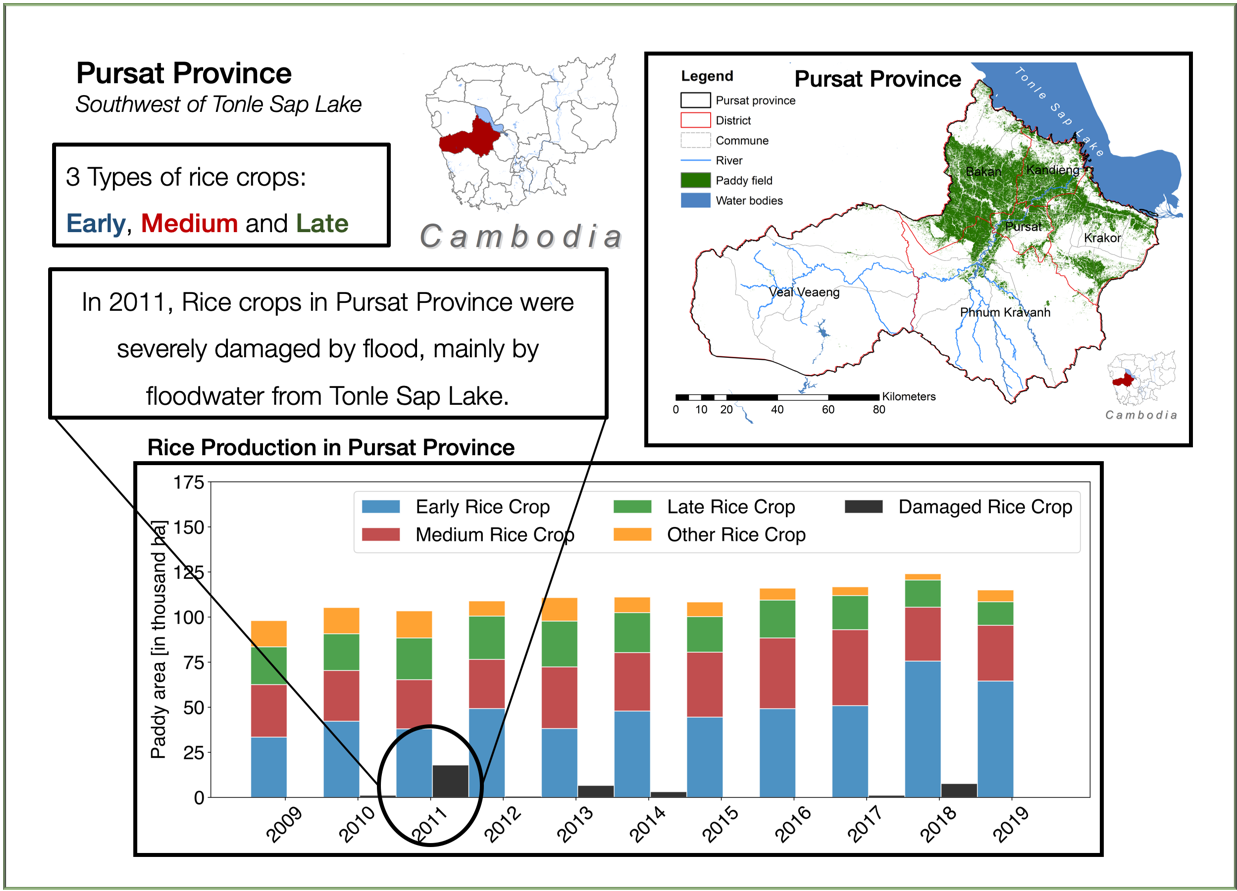
Pursat province is located at the Southwest of Tonle Sap Lake in Cambodia. It is known as one of the most vulnerable provinces to flood disasters in the country.
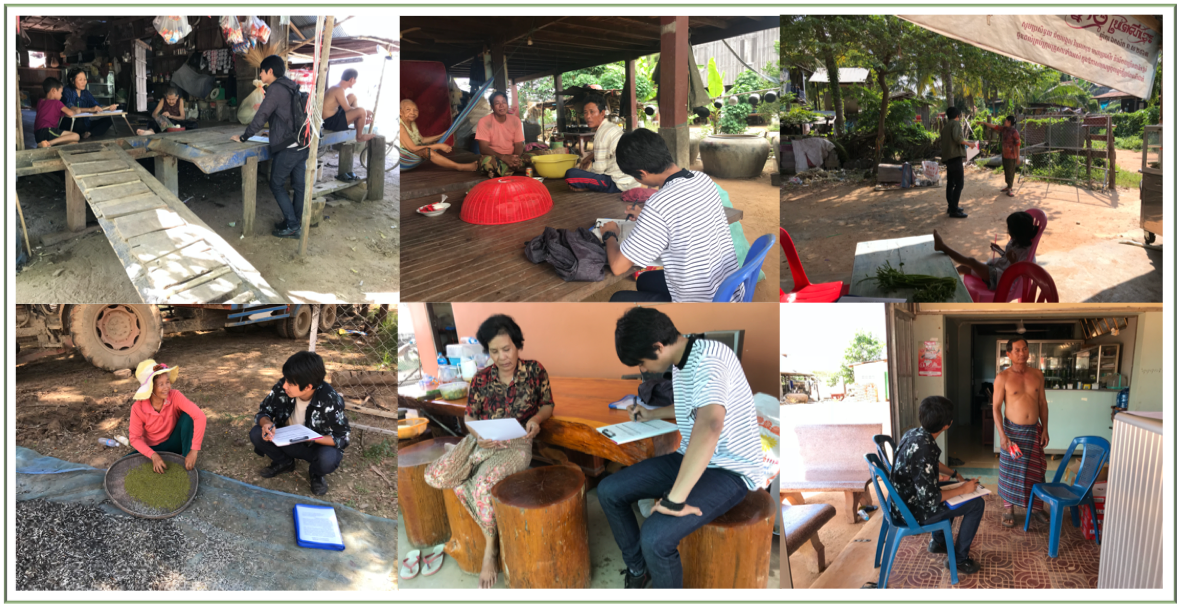
2. Field Survey
Target locations: villages which are located in the flood plain areas and in each districts.
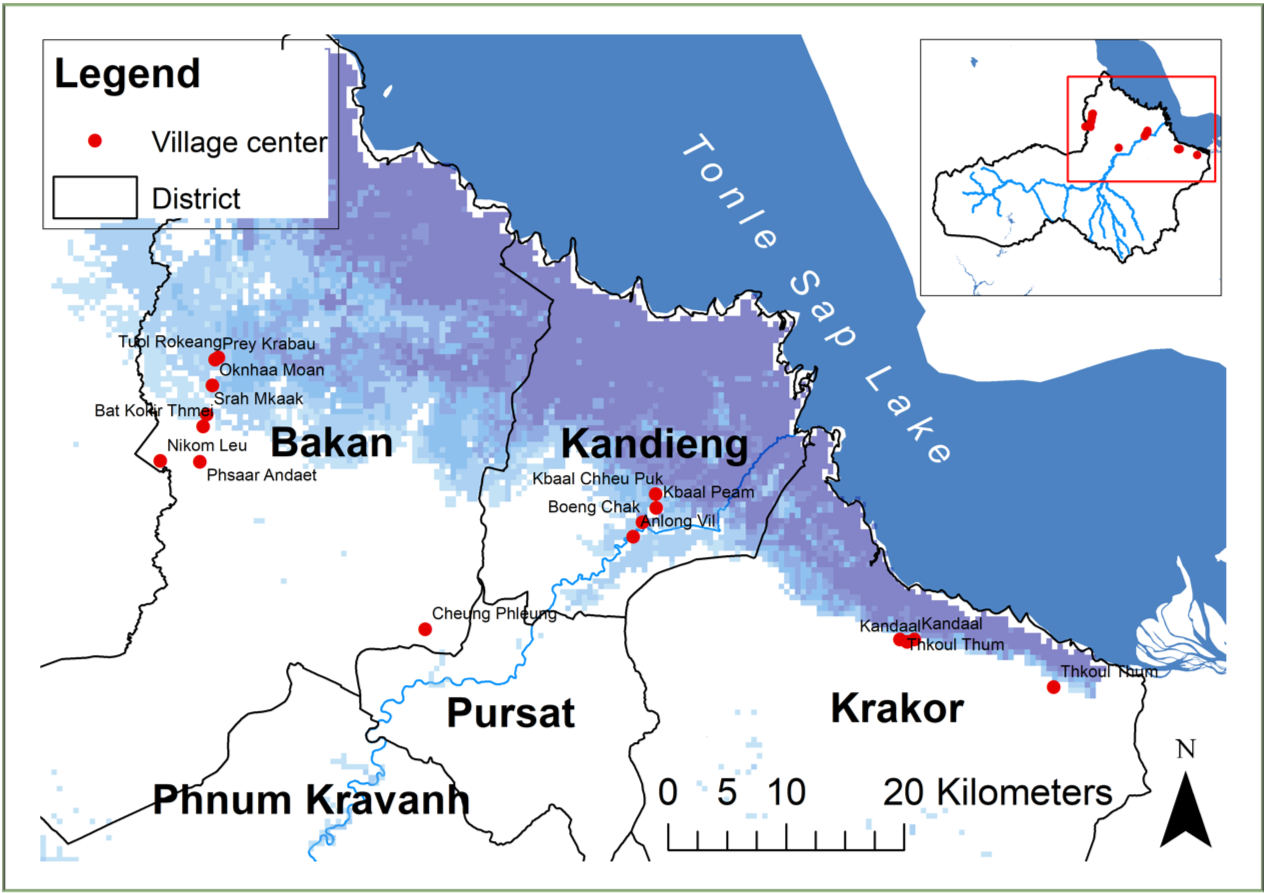
Target farmers: those who had experienced the rice crop damages caused by flood disasters. Flood depth and duration in their rice fields, and damage of their rice production were focused.
Methodology
Figure 5 shows the conceptual framework of this study.
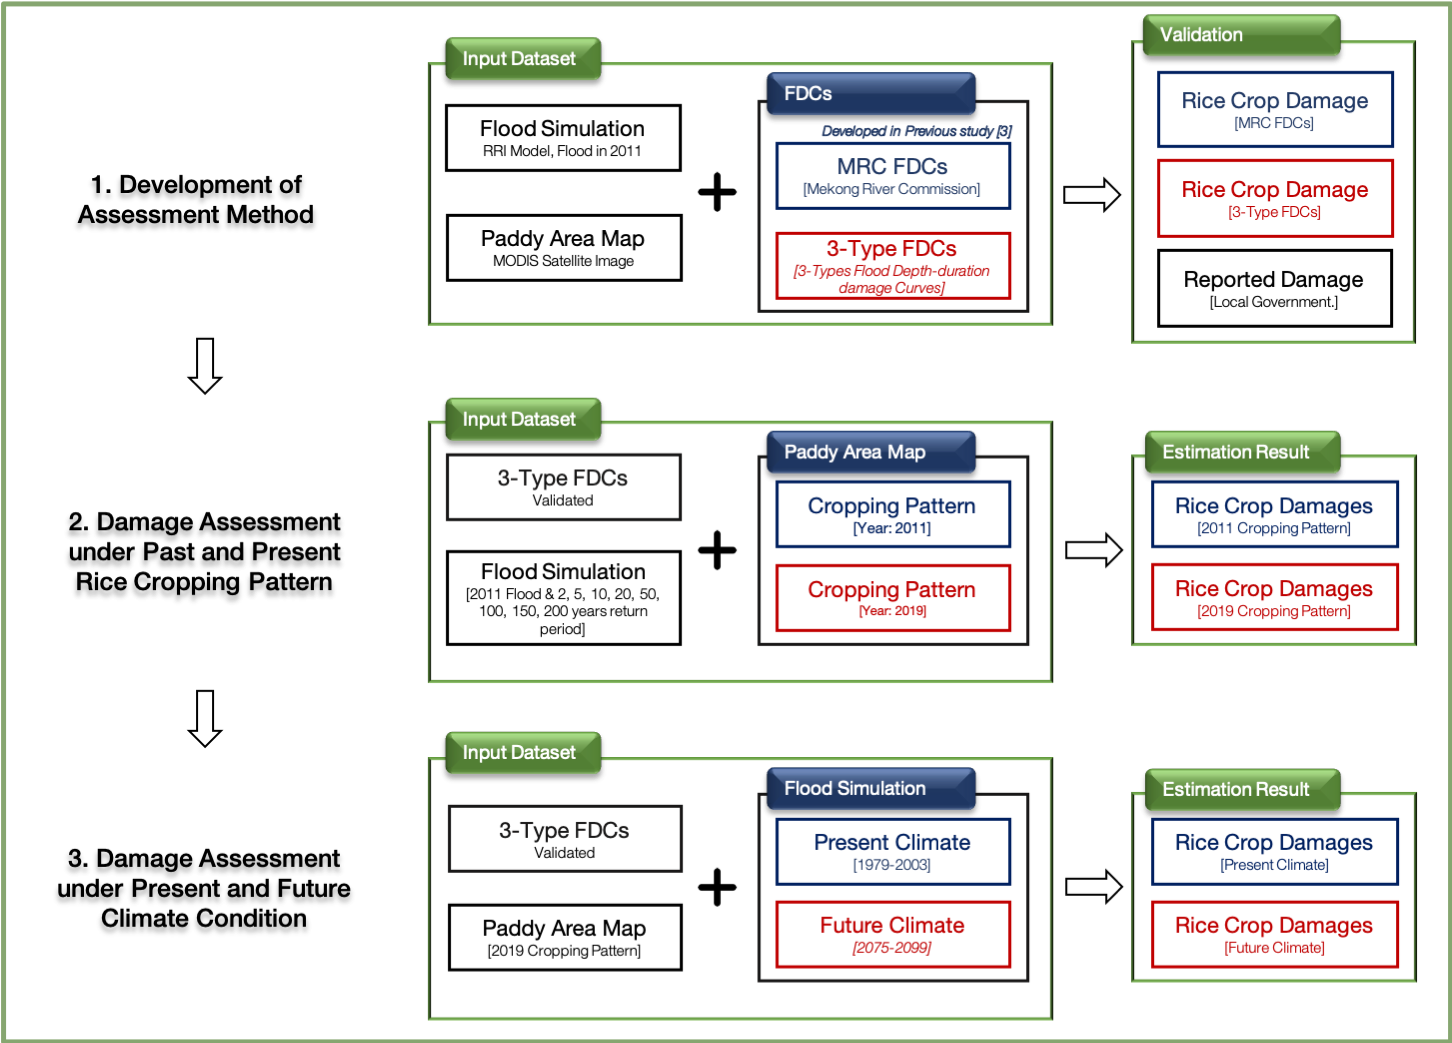
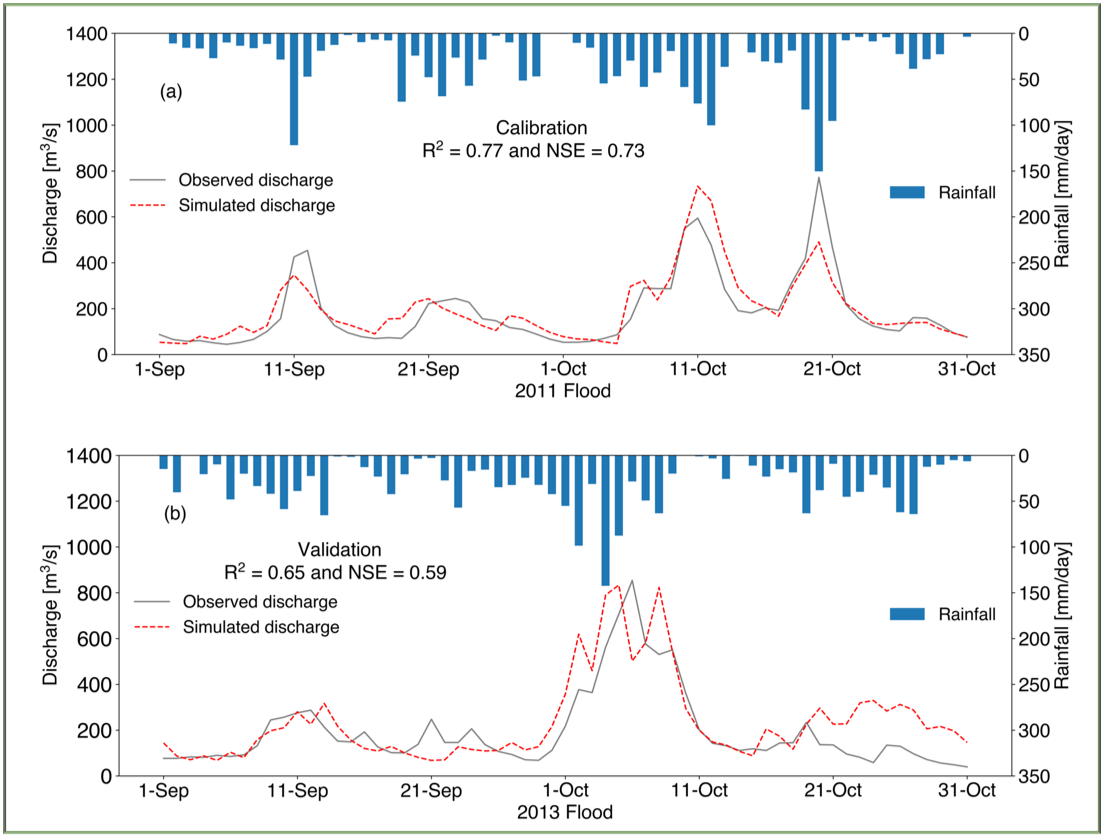
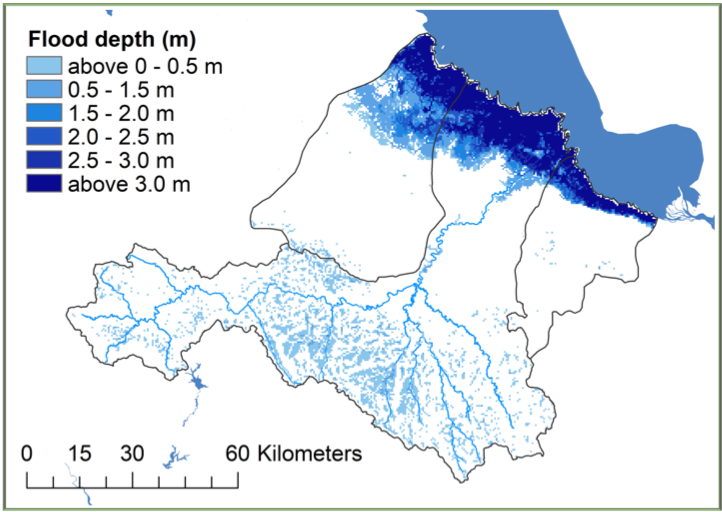
1. Flood Simulation
The simulation of flood events including 2011 flood (Figure 6a & 6b), 2-y to 200-y return period floods, and floods under present and future climate were conducted using Rainfall-Runoff Inundation (RRI) model [3].
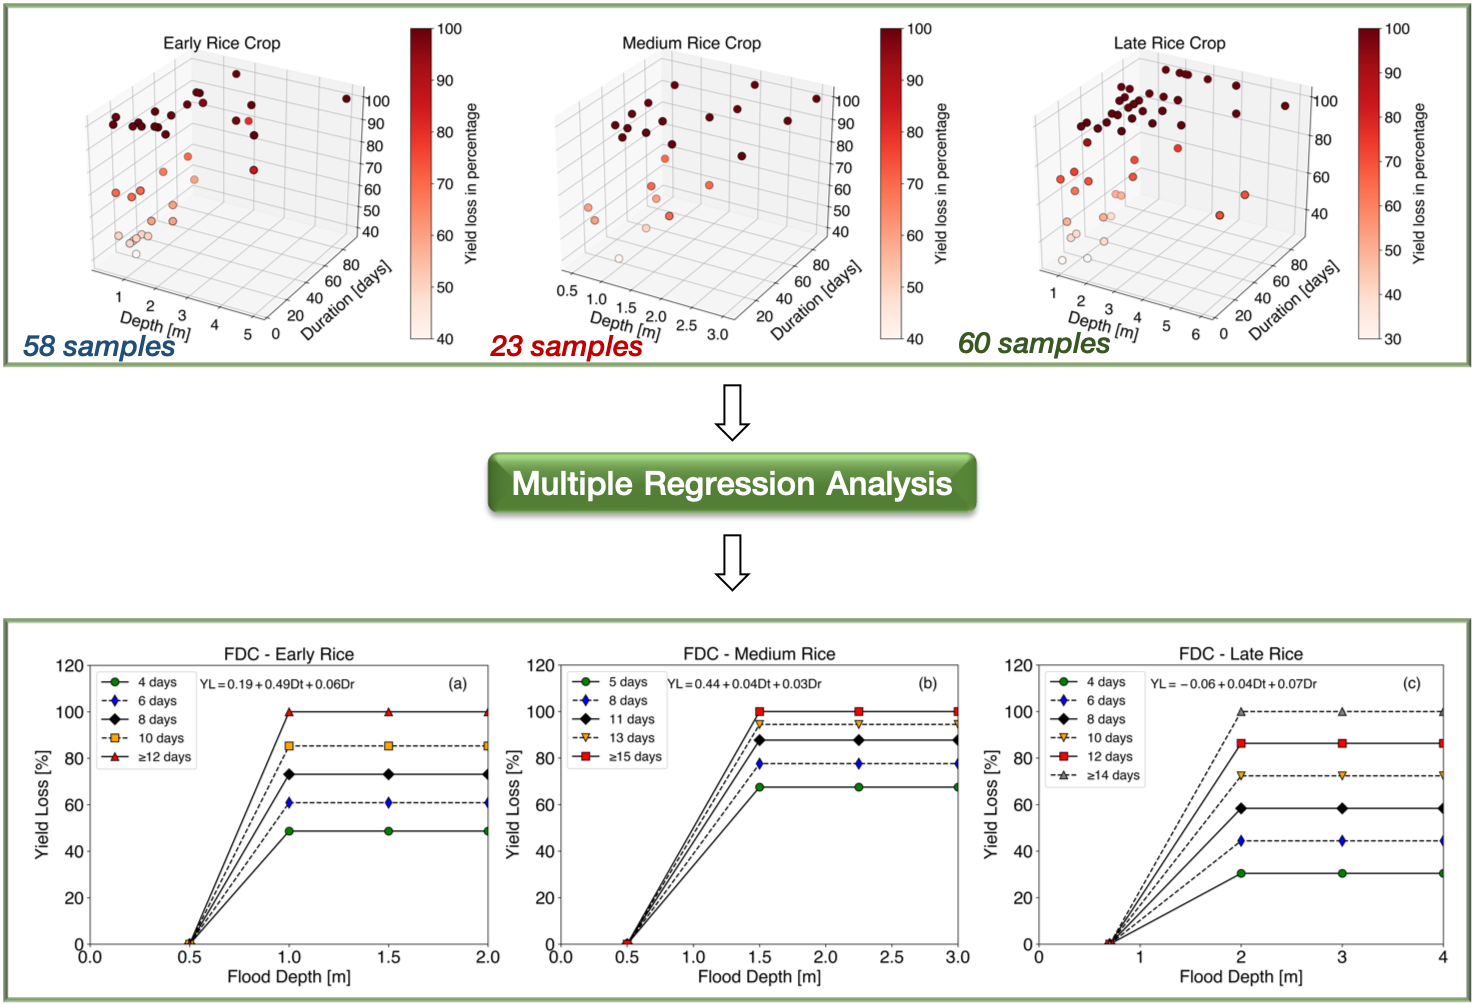
2. Development of 3-Types FDCs
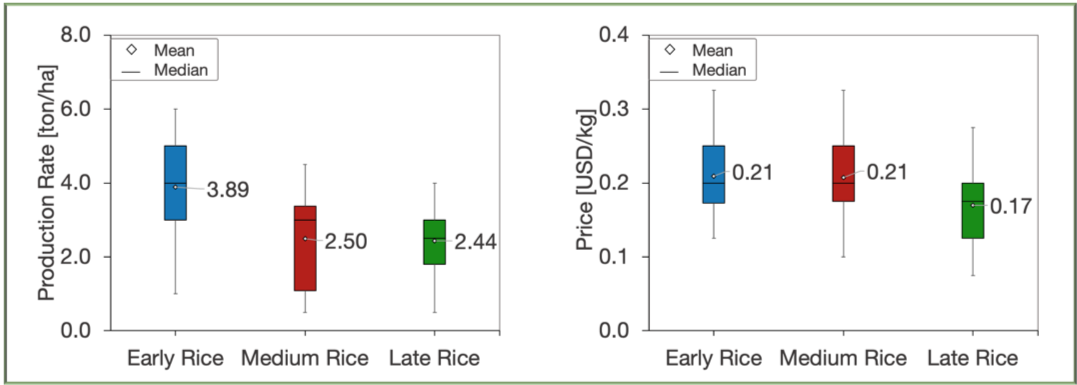
The data collected from field survey with 95 local farmers were used to develop flood depth-duration damage curves (Figure 7) and also to determine the rice production rate and farm gate price for damage cost calculation (Figure 8).
3. Development of Paddy Area Map
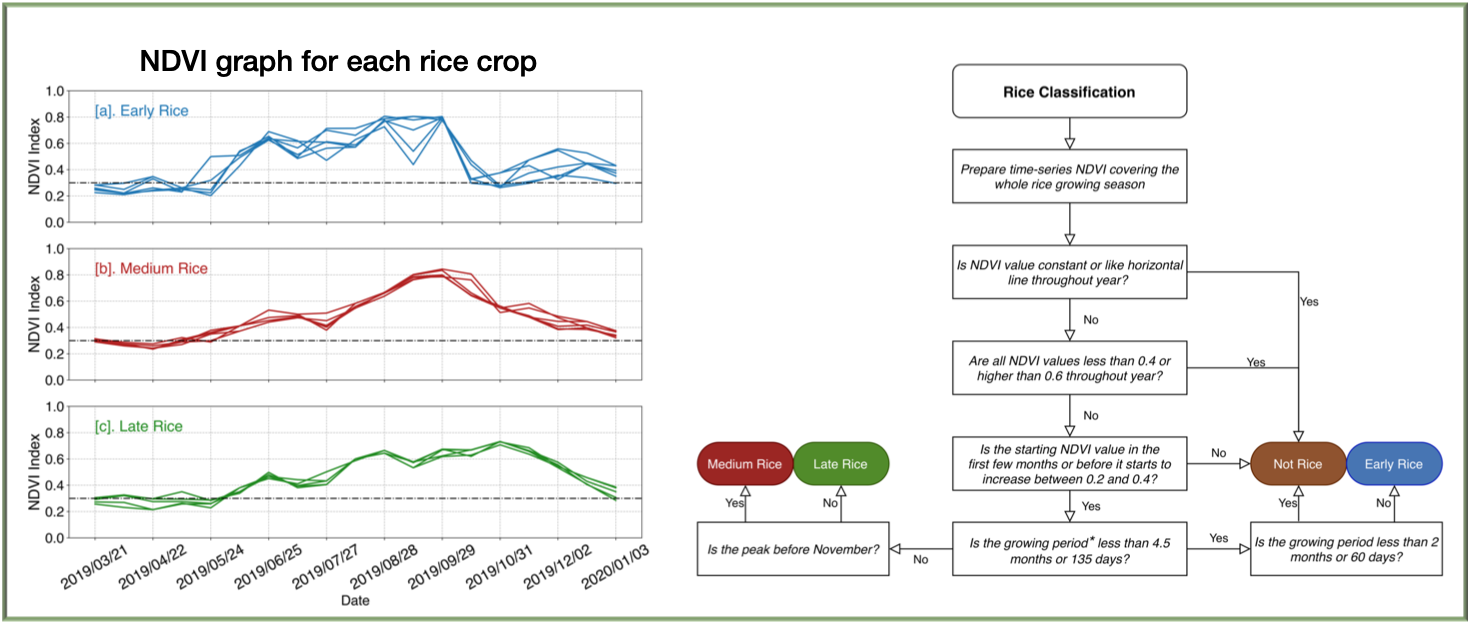
Based on the report from local government which indicates the location of early, medium and late paddy areas, the characteristics of NDVI time series for each type of rice were observed from MODIS Satellite Data (Figure 9. left). From this observation, the method to classify the paddy areas for early, medium and late rice crops were determined (Figure 9. right).
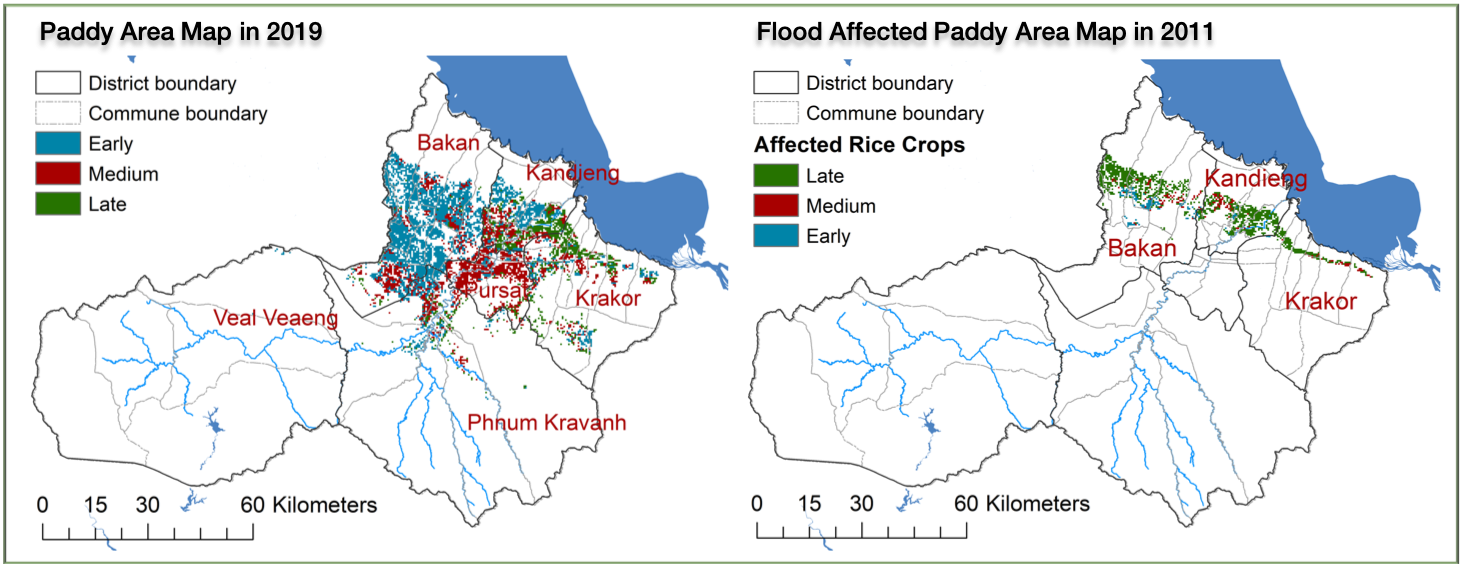
By following the above classification method, the paddy area map in 2019 (present cropping pattern) and flood-affected paddy area map in 2011 (past cropping pattern) were developed.
Flood damage assessment
1. Validation of Assessment Method
The flood damages were assessed based on flood simulation, paddy area map, and 3-Type FDCs. The results were compared with the damage estimated by using previous method (Table 1).
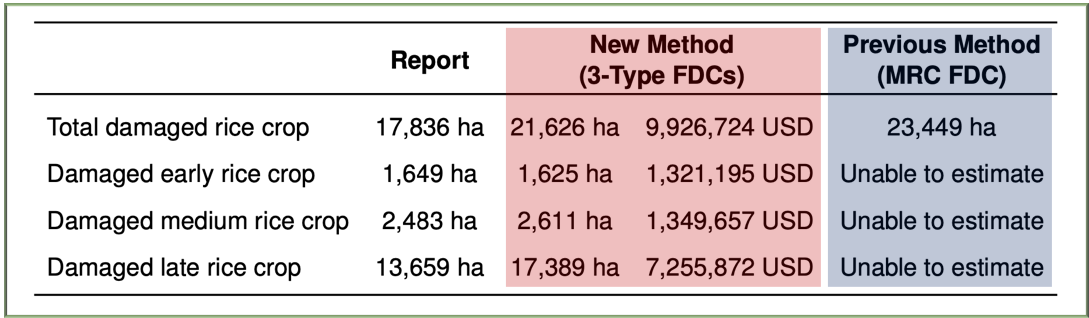
- The total damage of rice crop estimated by 3-Type FDCs well agreed with the reported damage.
- The newly developed method could assess the damage based on rice type, while it is unable with the conventional MRC method.
2. Assessment under Past and Present Cropping Pattern
Under the flood magnitude of various return period, the rice crop damage on past and present cropping patterns were assessed based on 3-Type FDCs.
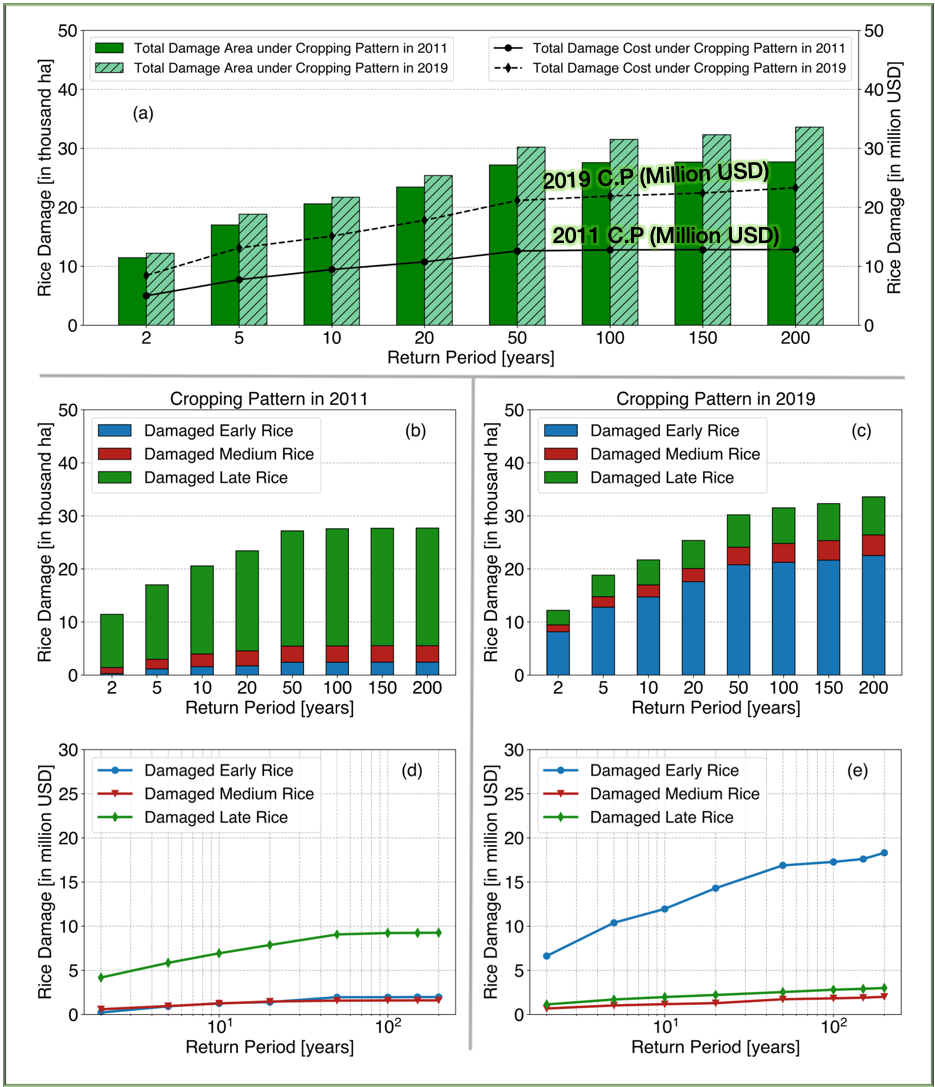
- Damage area and damage cost of present cropping pattern were overall greater than the past. It also increases following the larger flood magnitudes.
- Under present cropping pattern, the damage is mainly attributed to Early rice crop, while in the past cropping pattern, the main contribution is from Late rice crop.
- First, it is because the area of rice cultivation expanded significantly in the present pattern. Last is because early rice has high price and production rate compared to others, so the more early rice is grown, the more damage comes from early rice.
Therefore, present cropping pattern requires higher budget for saving rice production chain after flooding. This information can be used for long-term cost-benefit analysis.
3. Assessment under Present and Future Climate
Based on MRI-AGCM3.2S precipitation datasets from previous study [2], the damage under the past and future climate were assessed (Figure12).
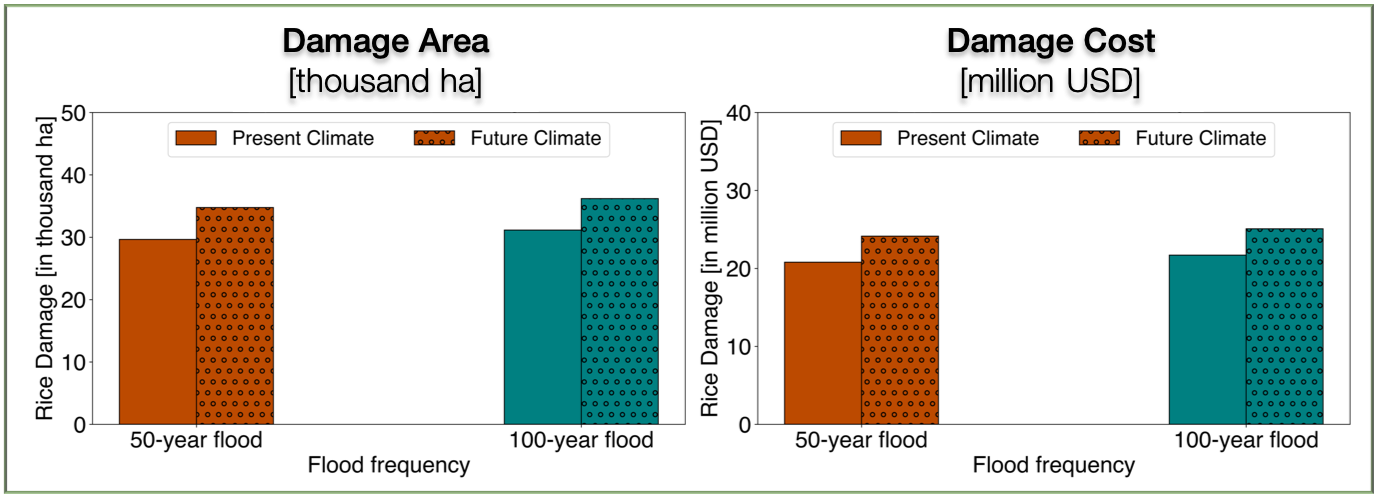
- There would be overall growth of rice crop damage in the future climate.
- Total damage under future climate would be more than 35,000 ha or 25 million USD = 14% higher than damage under present climate.
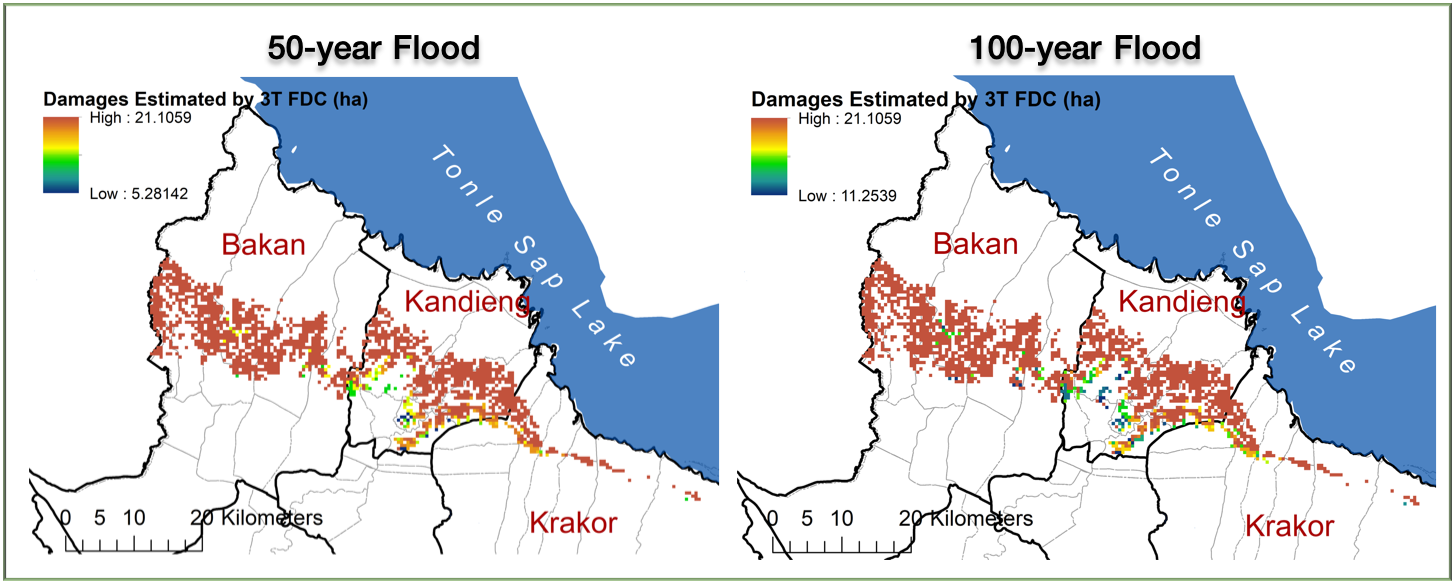
- Bakan and Kandieng district are the most affected and damaged area in the future climate condition since they have more rice fields compared to others.
Conclusion and acknowledgement
Summary
- Flood Depth-duration damage Curves (3-Type FDCs) for Early, Medium and Late rice crop were developed and showed more advantages over previous assessment methods.
- Comparison of cropping patterns, and analysis of climate change impact were studied.
- Method for creating Paddy Area Map based on MODIS satellite image was developed.
Impact
- This study enriches more understanding on how early, medium and late rice crops are affected by floodwater with the function of flood depth and flood duration.
- The developed method can be applicable in other areas; particularly, in area with scarce data.
- This study also provides an essential information about the areas of risk based on flood damage estimation and the impact of climate change on all types of rice crop
- It can be useful for future development activities; in particular, when it comes to establishing a flood mitigation policy for the sake of disaster risk reduction and implementing the flood mitigation actions for climate change adaptation.
Acknowledgement
This research was financially supported by Japanese Government (MEXT) Scholarship Program, educational support and guidance from River and Environmental Engineering Laboratory at The University of Tokyo. Furthermore, the field investigation was supported by JSPS KAKENHI Grant Number 18H03823 and the Water Cycle Data Integrator, Academic-Industry Collaboration Program, The University of Tokyo. The author also would like to highly appreciate all persons concerned and Cambodian government officers who helped facilitate towards the completion of this study.
Reference
[1] IRRI, “Crop calendar,” tech. rep., International Rice Research Institute.
[2] B.B.Shrestha,E.D.P.Perera,S.Kudo,M.Miyamoto,Y.Yamazaki,D.Kuribayashi, H. Sawano, T. Sayama, J. Magome, A. Hasegawa, et al., “Assessing flood disaster impacts in agriculture under climate change in the river basins of southeast asia,” Natural Hazards, vol. 97, no. 1, pp. 157–192, 2019.
[3] T. Sayama, G. Ozawa, T. Kawakami, S. Nabesaka, and K. Fukami, “Rainfall– runoff–inundation analysis of the 2010 pakistan flood in the kabul river basin,” Hydrological Sciences Journal, vol. 57, no. 2, pp. 298–312, 2012.