Python: Number of Covid-19 Confirmed Cases in Tokyo.
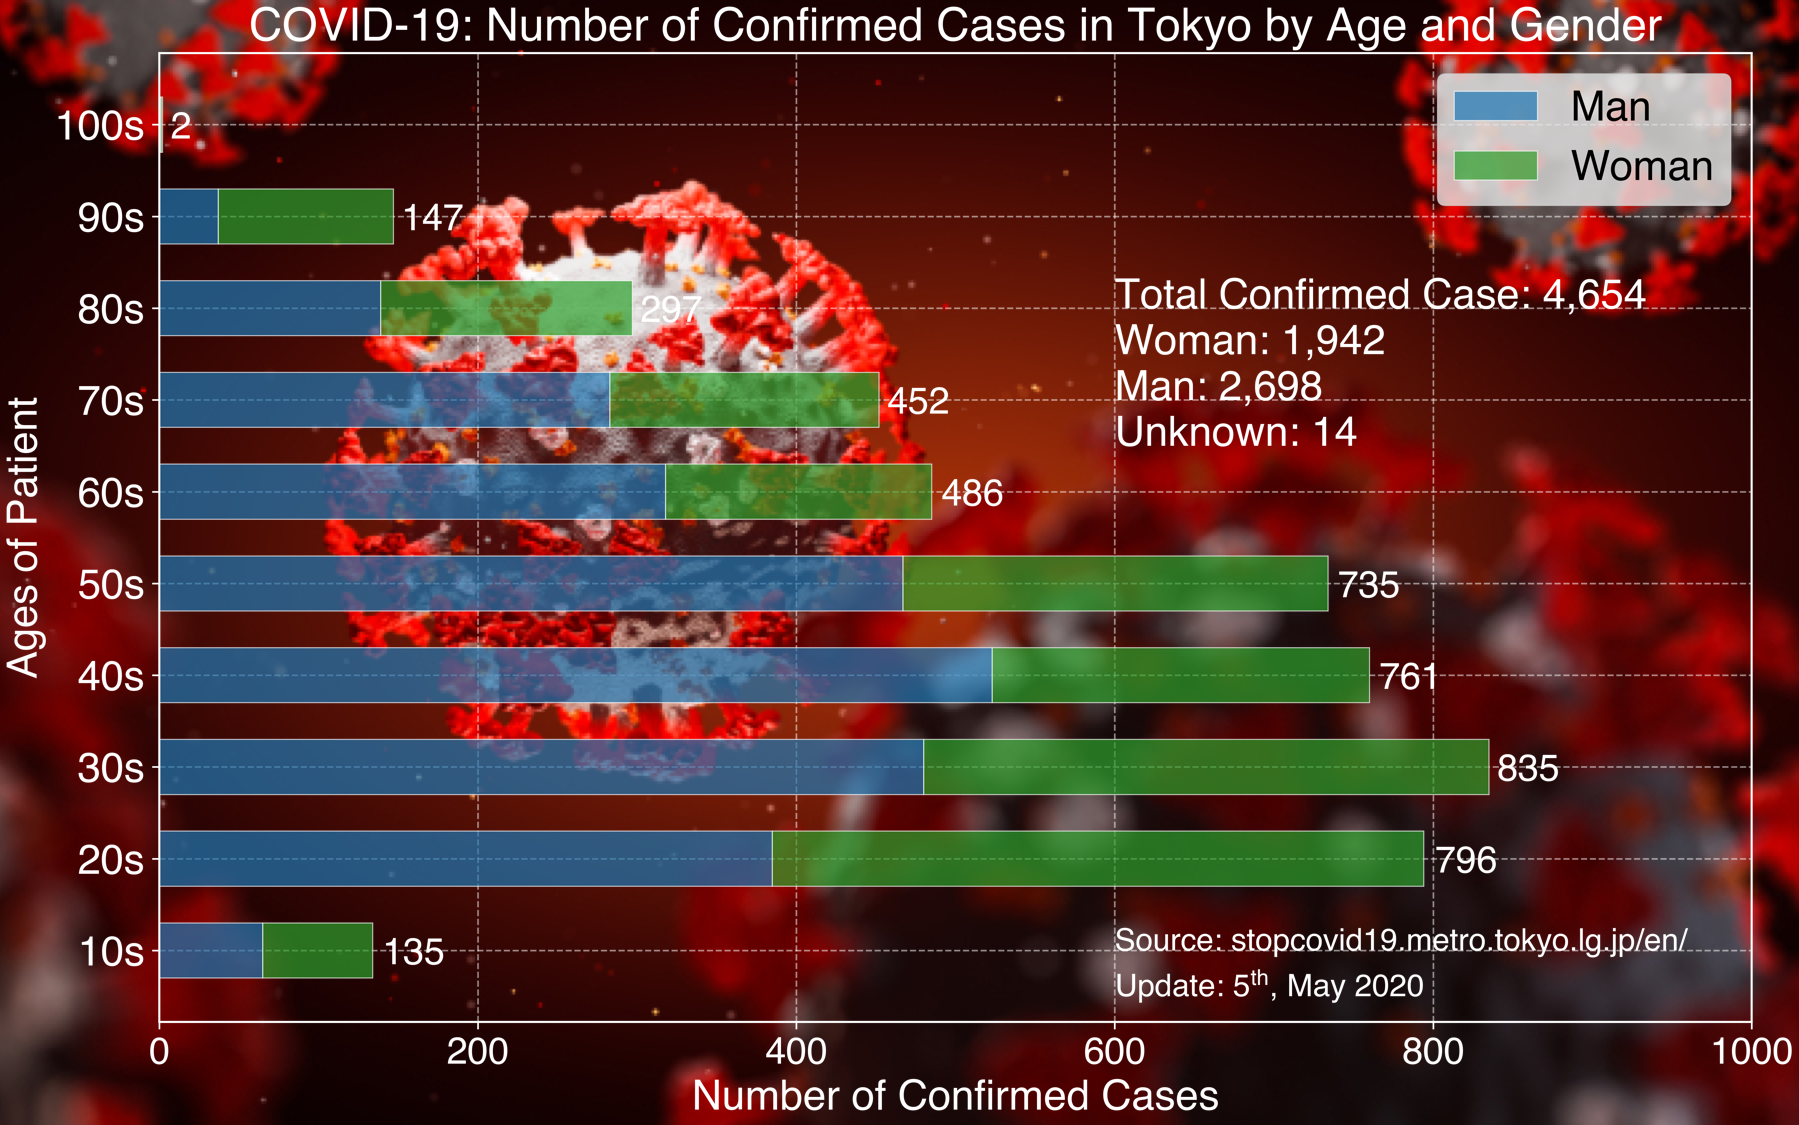
Here I will show how to plot horizontal bar chart to show the number of Covid-19 confirmed cases in Tokyo with the code written in Python Jupiter Notebook.
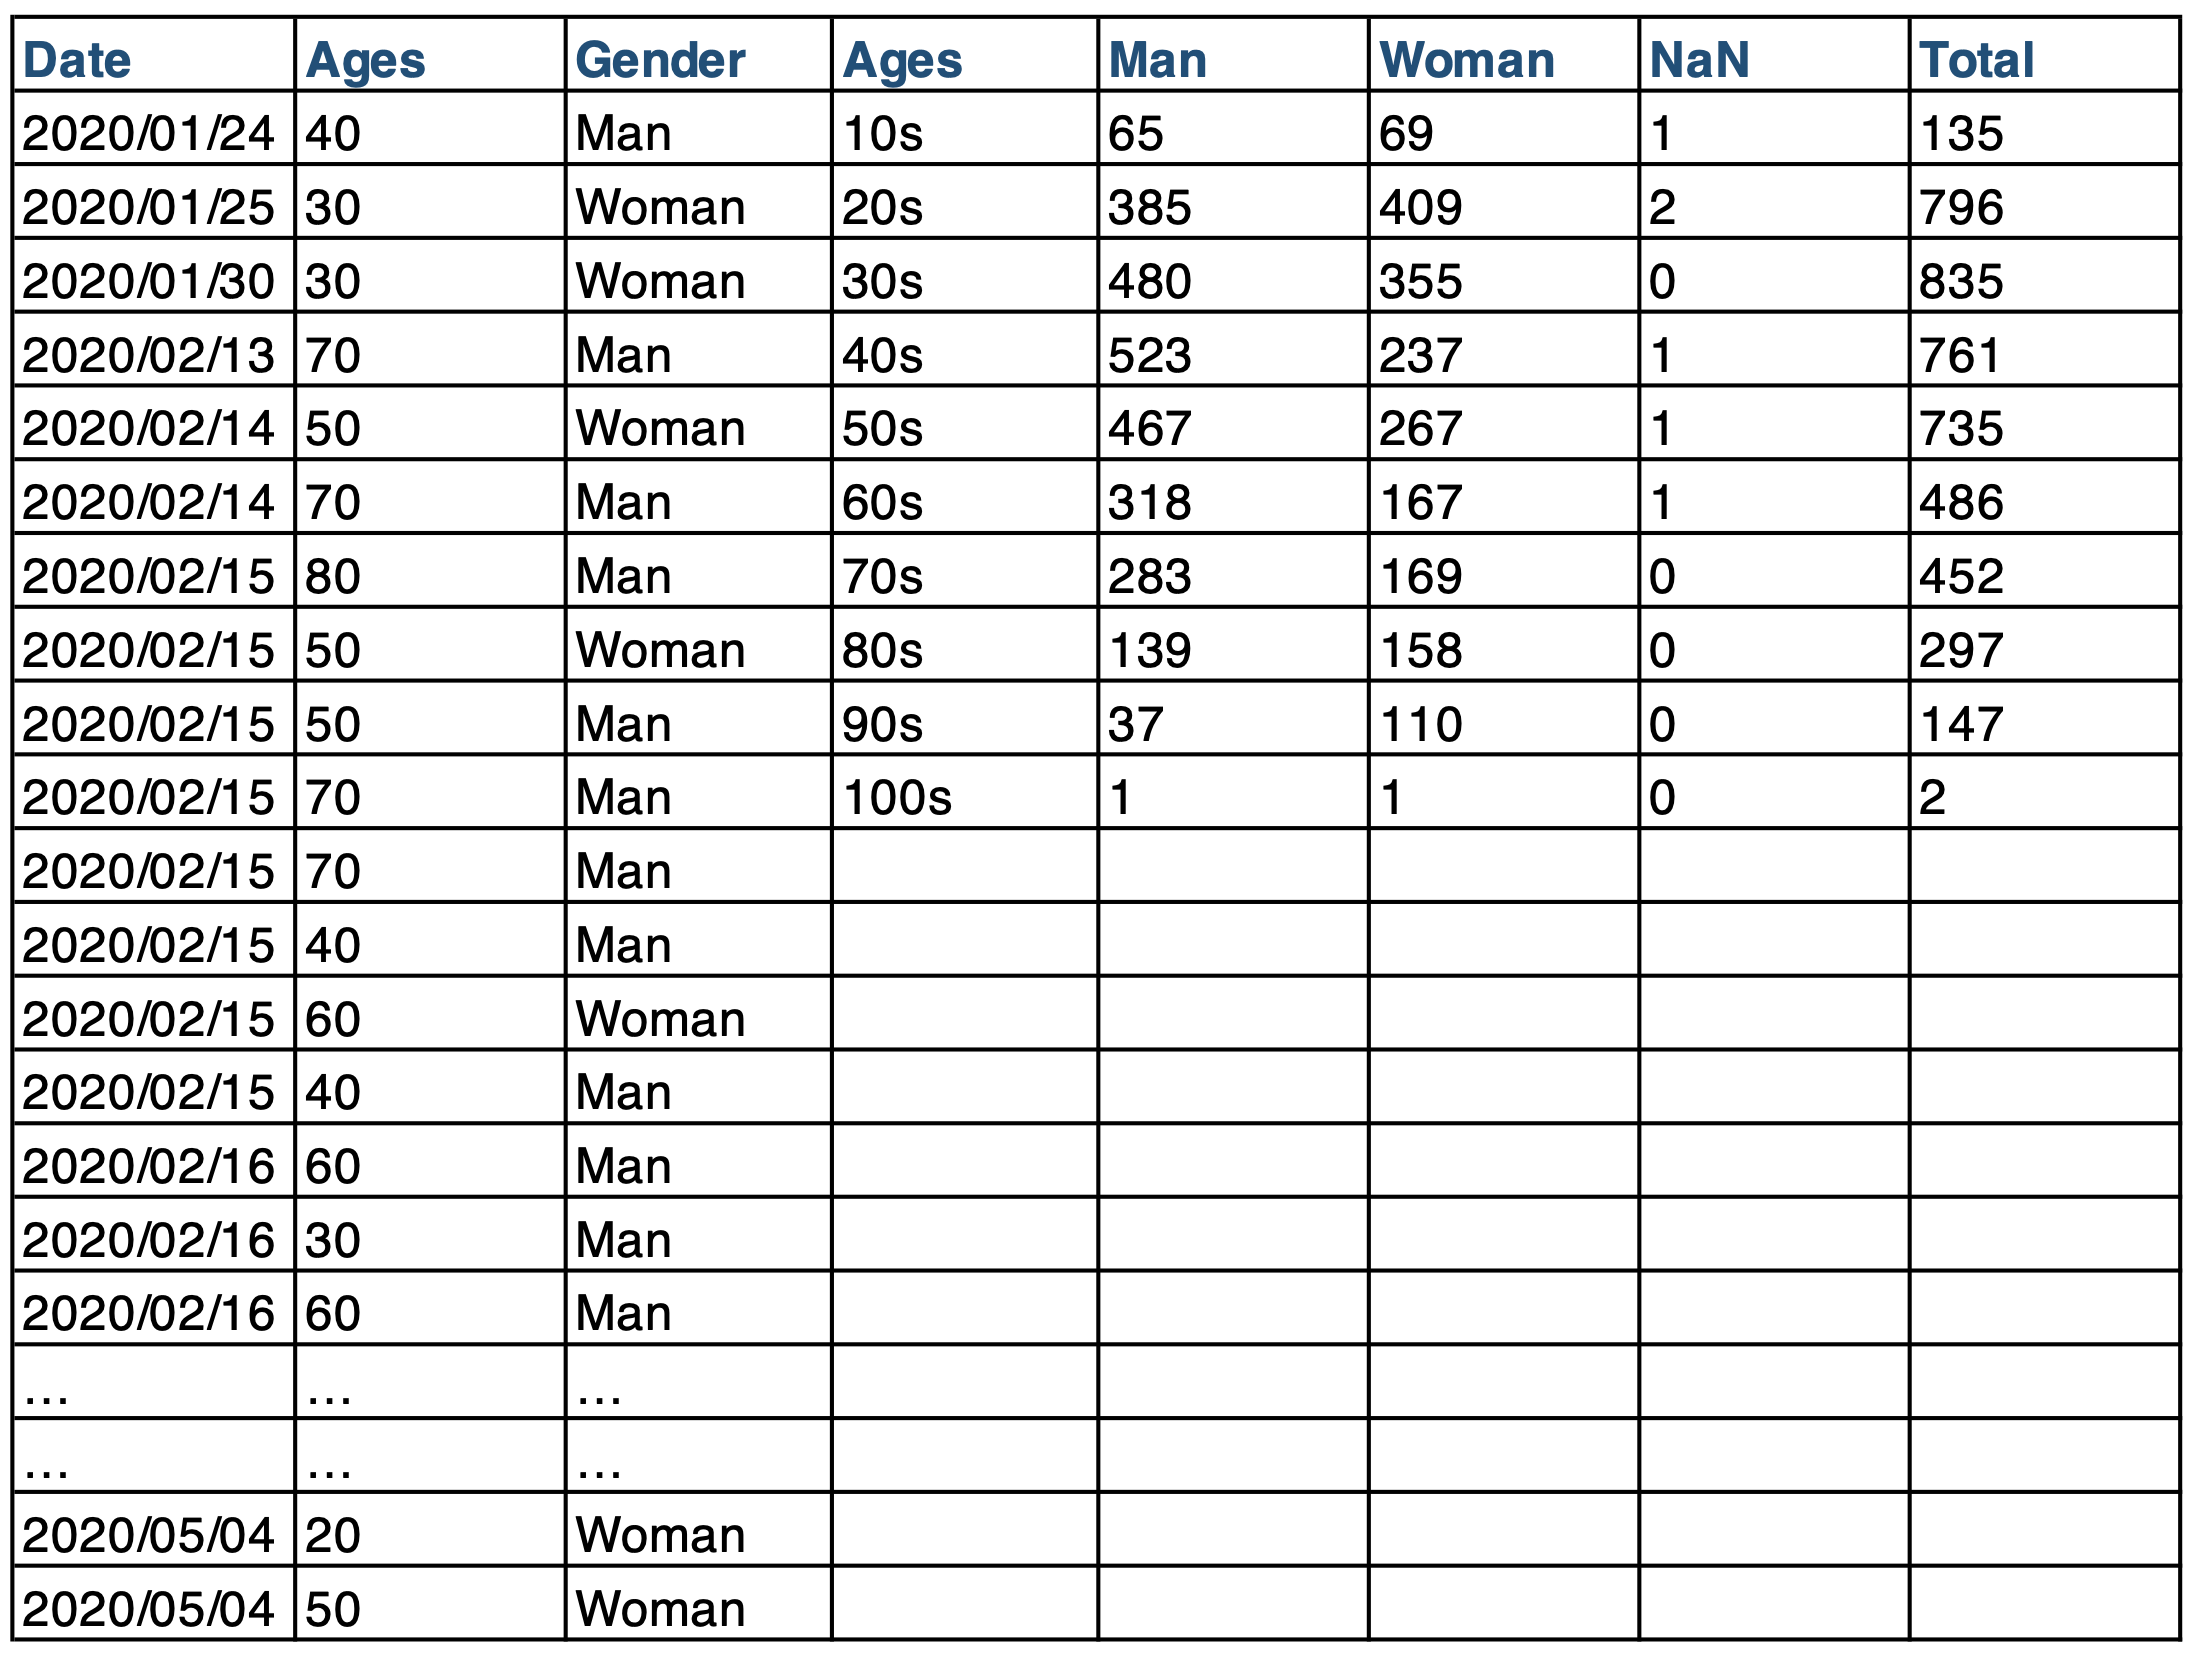
1. Data Table
Data source name: data_table.csv

2. Code
---
import matplotlib.pyplot as plt
import numpy as np
import pandas as pd
from matplotlib import rc
from collections import Counter
import matplotlib

# set font type
rc('font',**{'family':'sans-serif','sans-serif':['Helvetica'],'size':10})
rc('mathtext',**{'default':'regular'})

%matplotlib inline

# The following %config line changes the inline figures to have a higher DPI.
# You can comment out (#) this line if you don't have a high-DPI (~220) display.
%config InlineBackend.figure_format = 'retina'

# import data table
df = pd.read_csv('covid-data.csv')

# assign values
age = df.iloc[:10,3]
man = df.iloc[:10,4]
woman = df.iloc[:10,5]
total = df.iloc[:10,7]
xl = np.arange(len(age))
img = plt.imread("covid.jpg")

# create plot
fig = plt.figure(figsize=(12,7.5),constrained_layout=True)
plt.rc('xtick', labelsize=18, color = 'white')
plt.rc('ytick', labelsize=20)
plt.rc('axes', labelsize=20)
bar_height = 0.6
plt.grid(which='major',linestyle='--', axis = 'y',alpha=.5)
plt.grid(which='major',linestyle='--', axis = 'x',alpha=.5)
plt.barh(xl, man, height=bar_height, label='Man', edgecolor='white', color ='tab:blue', zorder = 2, alpha = 0.7)
plt.barh(xl, woman, height=bar_height, label='Woman', edgecolor='white',color ='tab:green', left = man, zorder = 2, alpha = 0.7)
plt.yticks(xl, age, color = 'white')
plt.title('COVID-19: Number of Confirmed Cases in Tokyo by Age and Gender', fontsize = 22, color = 'white')
plt.legend(loc='upper right', fontsize = 20)
plt.xlabel('Number of Confirmed Cases', color = 'white')
plt.ylabel('Ages of Patient', color = 'white')
plt.xlim(0,1000)
plt.text(600,0,'Source: stopcovid19.metro.tokyo.lg.jp/en/', fontsize = 15, color = 'white')
plt.text(600,-0.5, 'Update: 5$^{th}$, May 2020', fontsize = 15, color = 'white')
plt.text(600,7,'Total Confirmed Case: 4,654', fontsize = 20, color = 'white')
plt.text(600,6.5,'Woman: 1,942', fontsize = 20, color = 'white')
plt.text(600,6,'Man: 2,698', fontsize = 20, color = 'white')
plt.text(600,5.5,'Unknown: 14', fontsize = 20, color = 'white')
for index, value in enumerate(total):
    plt.text(value+5, index-0.15, int(value), fontsize = 18, color = 'white')
plt.savefig('covid-confirmed-cases.png', dpi = 600, transparent=True)
plt.show()
---
3. Plot

Source code is available at: GitHub


