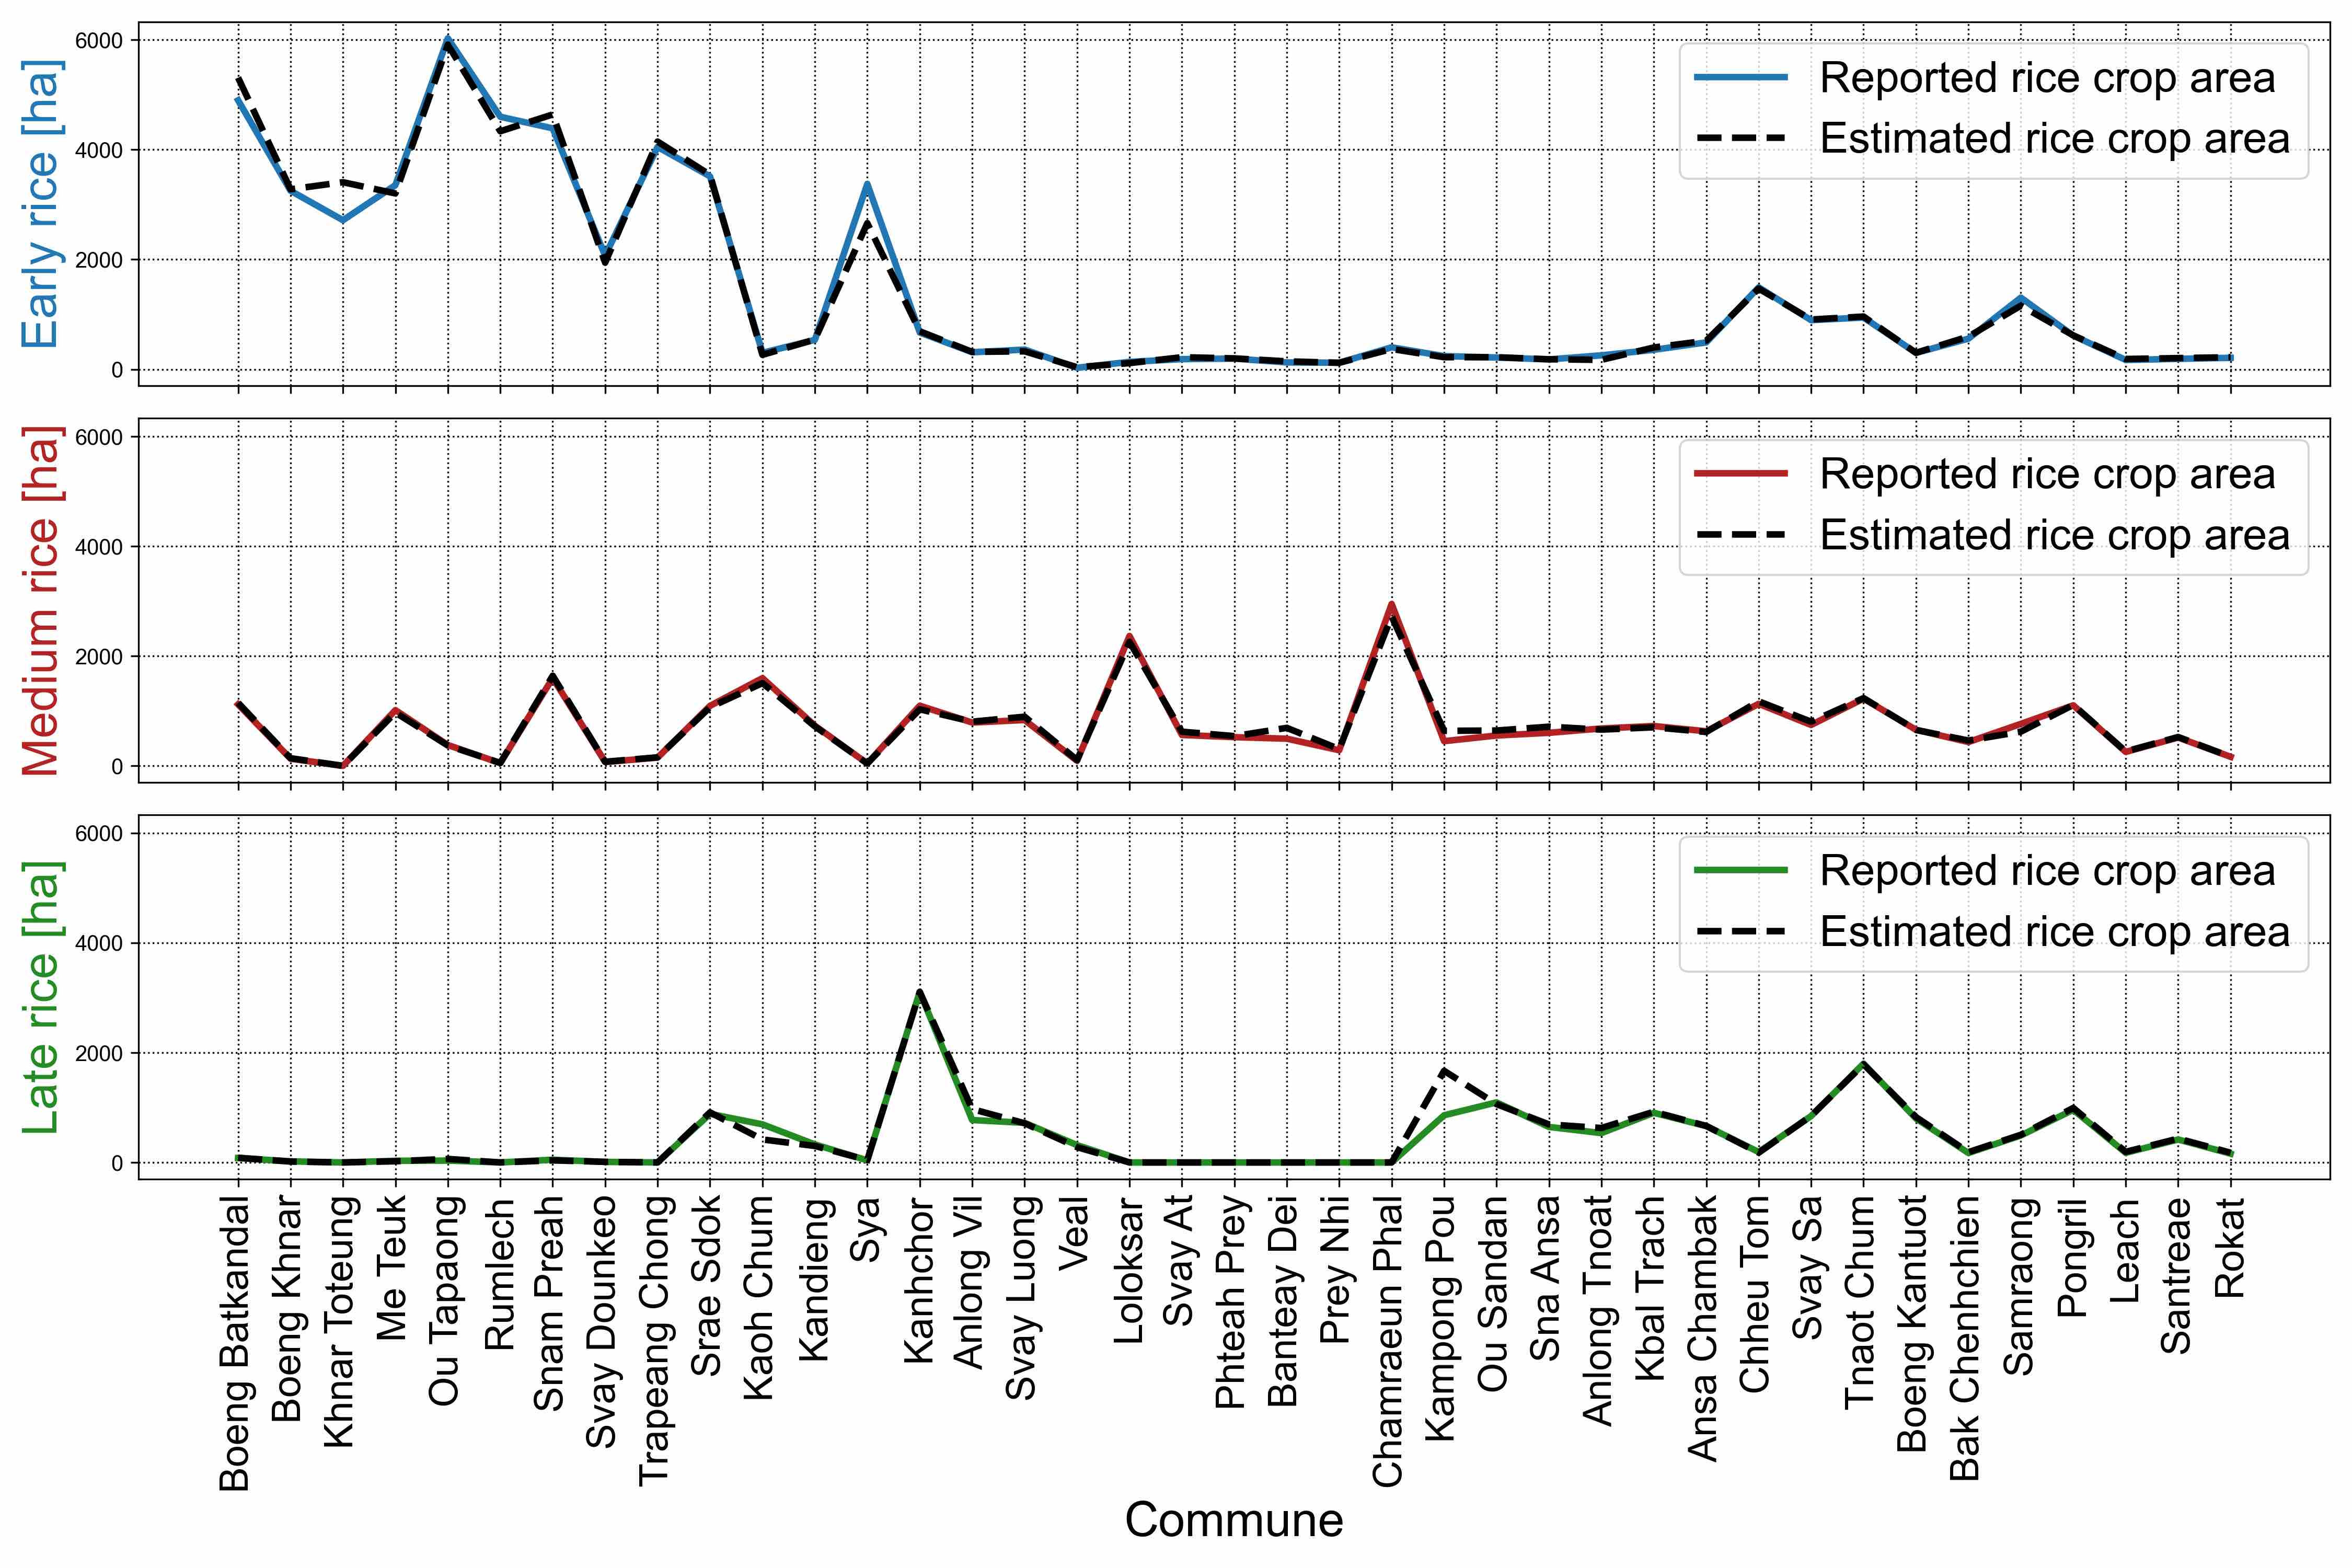
Python: Comparison of Reported and Estimated Rice Crop Area.
Here I will show how to plot three stacked line graph to show the comparion of reported and estimated rice crop area with the code written in Python Jupiter Notebook.
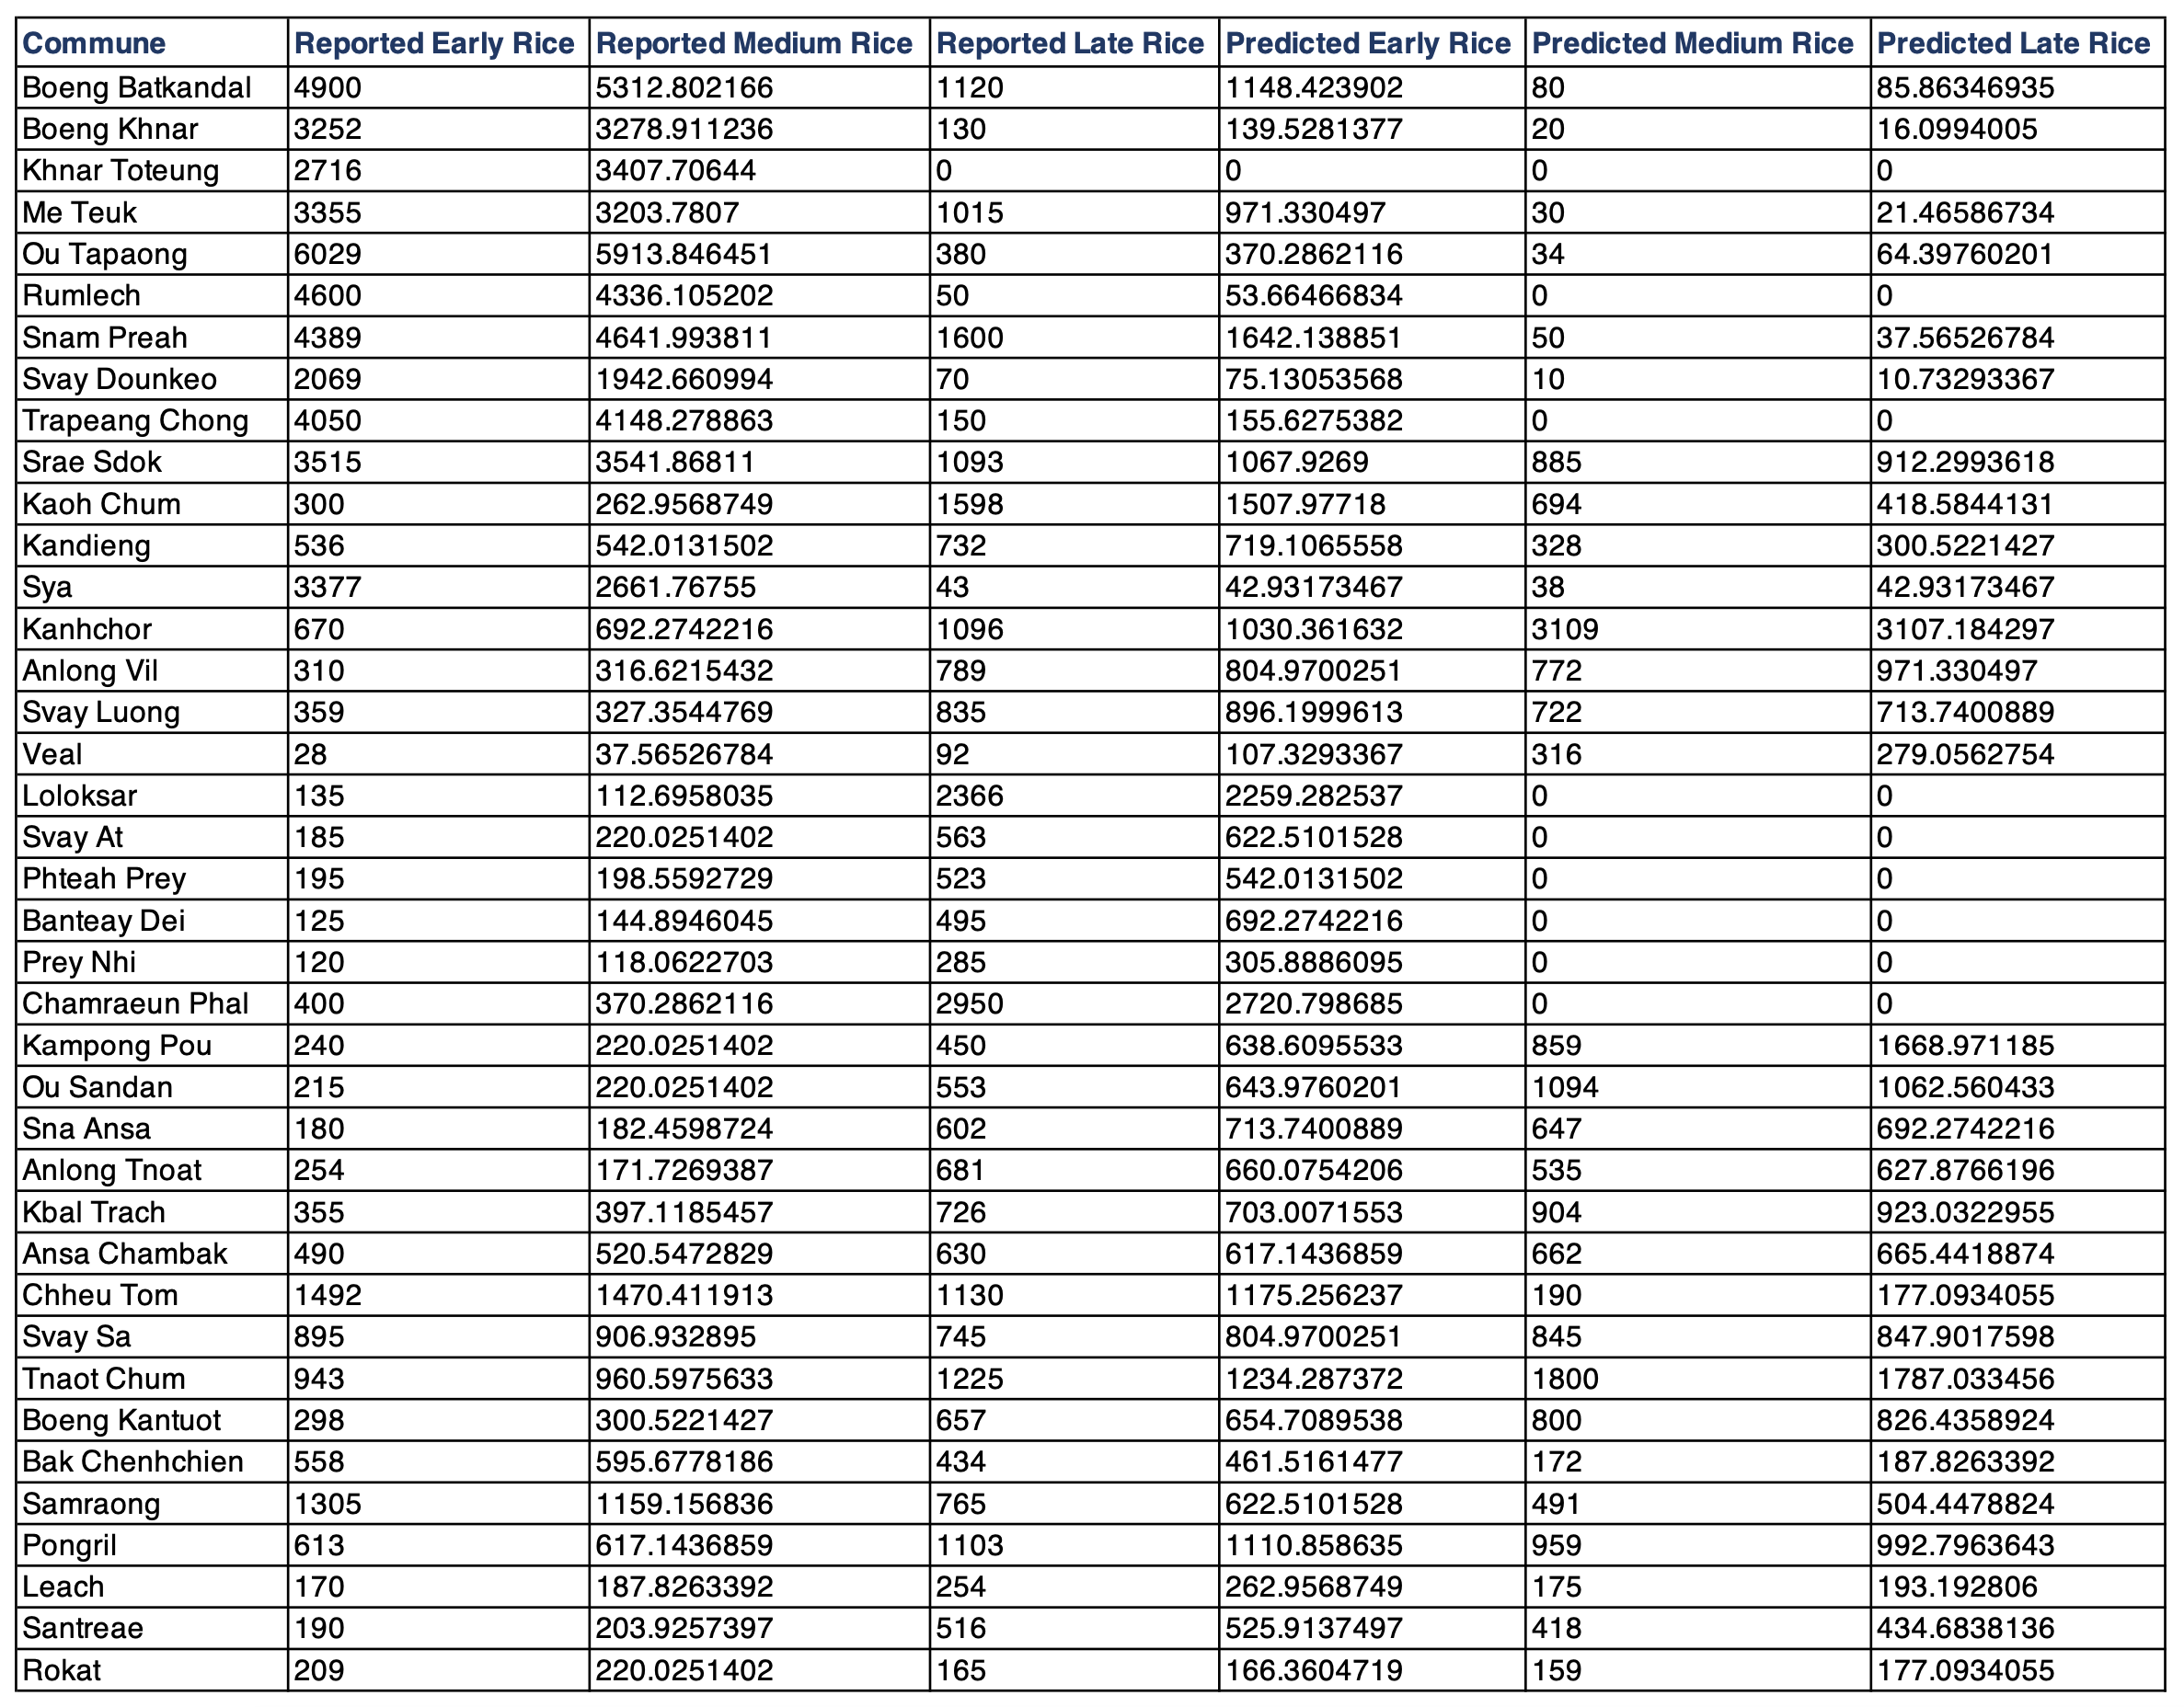
1. Data Table
Data source name: data_table.csv

2. Code
---
import numpy as np
import pandas as pd
import matplotlib.pyplot as plt
from matplotlib import rc

# set font type
plt.rcParams["font.family"] = "Arial"

# import data table
data_table = pd.read_csv('data_table.csv')

# assign values
communes = data_table.iloc[:,0].values
reported_er = data_table.iloc[:,1].values
reported_mr = data_table.iloc[:,3].values
reported_lr = data_table.iloc[:,5].values
predicted_er = data_table.iloc[:,2].values
predicted_mr = data_table.iloc[:,4].values
predicted_lr = data_table.iloc[:,6].values
indx = np.arange(len(communes))

# create plot
fig, axs = plt.subplots(3, sharex=True, sharey=True, figsize= (15,10))
# fig.suptitle('Rice Production by Communes', fontsize=20, fontweight = 'bold')
plt.rc('xtick', labelsize=15)
plt.rc('ytick', labelsize=15)
# plt.rc('axes', labelsize=22)
axs[0].plot(communes, reported_er, color = '#2077B4',linewidth=3, label='Reported rice crop area')
axs[0].plot(communes, predicted_er, color = 'black', linestyle='--',linewidth=3, label='Estimated rice crop area')
axs[0].set_ylabel('Early rice [ha]', fontsize= 22, color= '#2077B4')
axs[0].grid(linestyle='dotted', color='black')
axs[0].legend(loc='best', fontsize= 20)

axs[1].plot(communes, reported_mr, color = '#B22222',linewidth=3, label='Reported rice crop area')
axs[1].plot(communes, predicted_mr, color = 'black', linestyle='--',linewidth=3, label='Estimated rice crop area')
axs[1].set_ylabel('Medium rice [ha]', fontsize= 22, color= '#B22222')
axs[1].grid(linestyle='dotted', color='black')
# axs[1].set_ylim(0,4000)
axs[1].legend(loc='best', fontsize= 20)

axs[2].plot(communes, reported_lr, color = '#228B22',linewidth=3, label='Reported rice crop area')
axs[2].plot(communes, predicted_lr, color = 'black', linestyle='--',linewidth=3, label='Estimated rice crop area')
axs[2].set_ylabel('Late rice [ha]', fontsize= 22, color= '#228B22')
axs[2].set_xticklabels(labels=communes,rotation=90, fontsize=18)
# axs[2].set_yticklabels(fontsize=20)
axs[2].grid(linestyle='dotted', color='black')
axs[2].legend(loc='best', fontsize= 20)
axs[2].set_xlabel('Commune', fontsize= 22)

plt.tight_layout(True)
plt.savefig('validation-2019map.png', dpi= 300)
plt.show()
---
3. Plot

Source code is available at: GitHub


