Python: Comparison of Reported and Estimated Affected Rice Crop Area
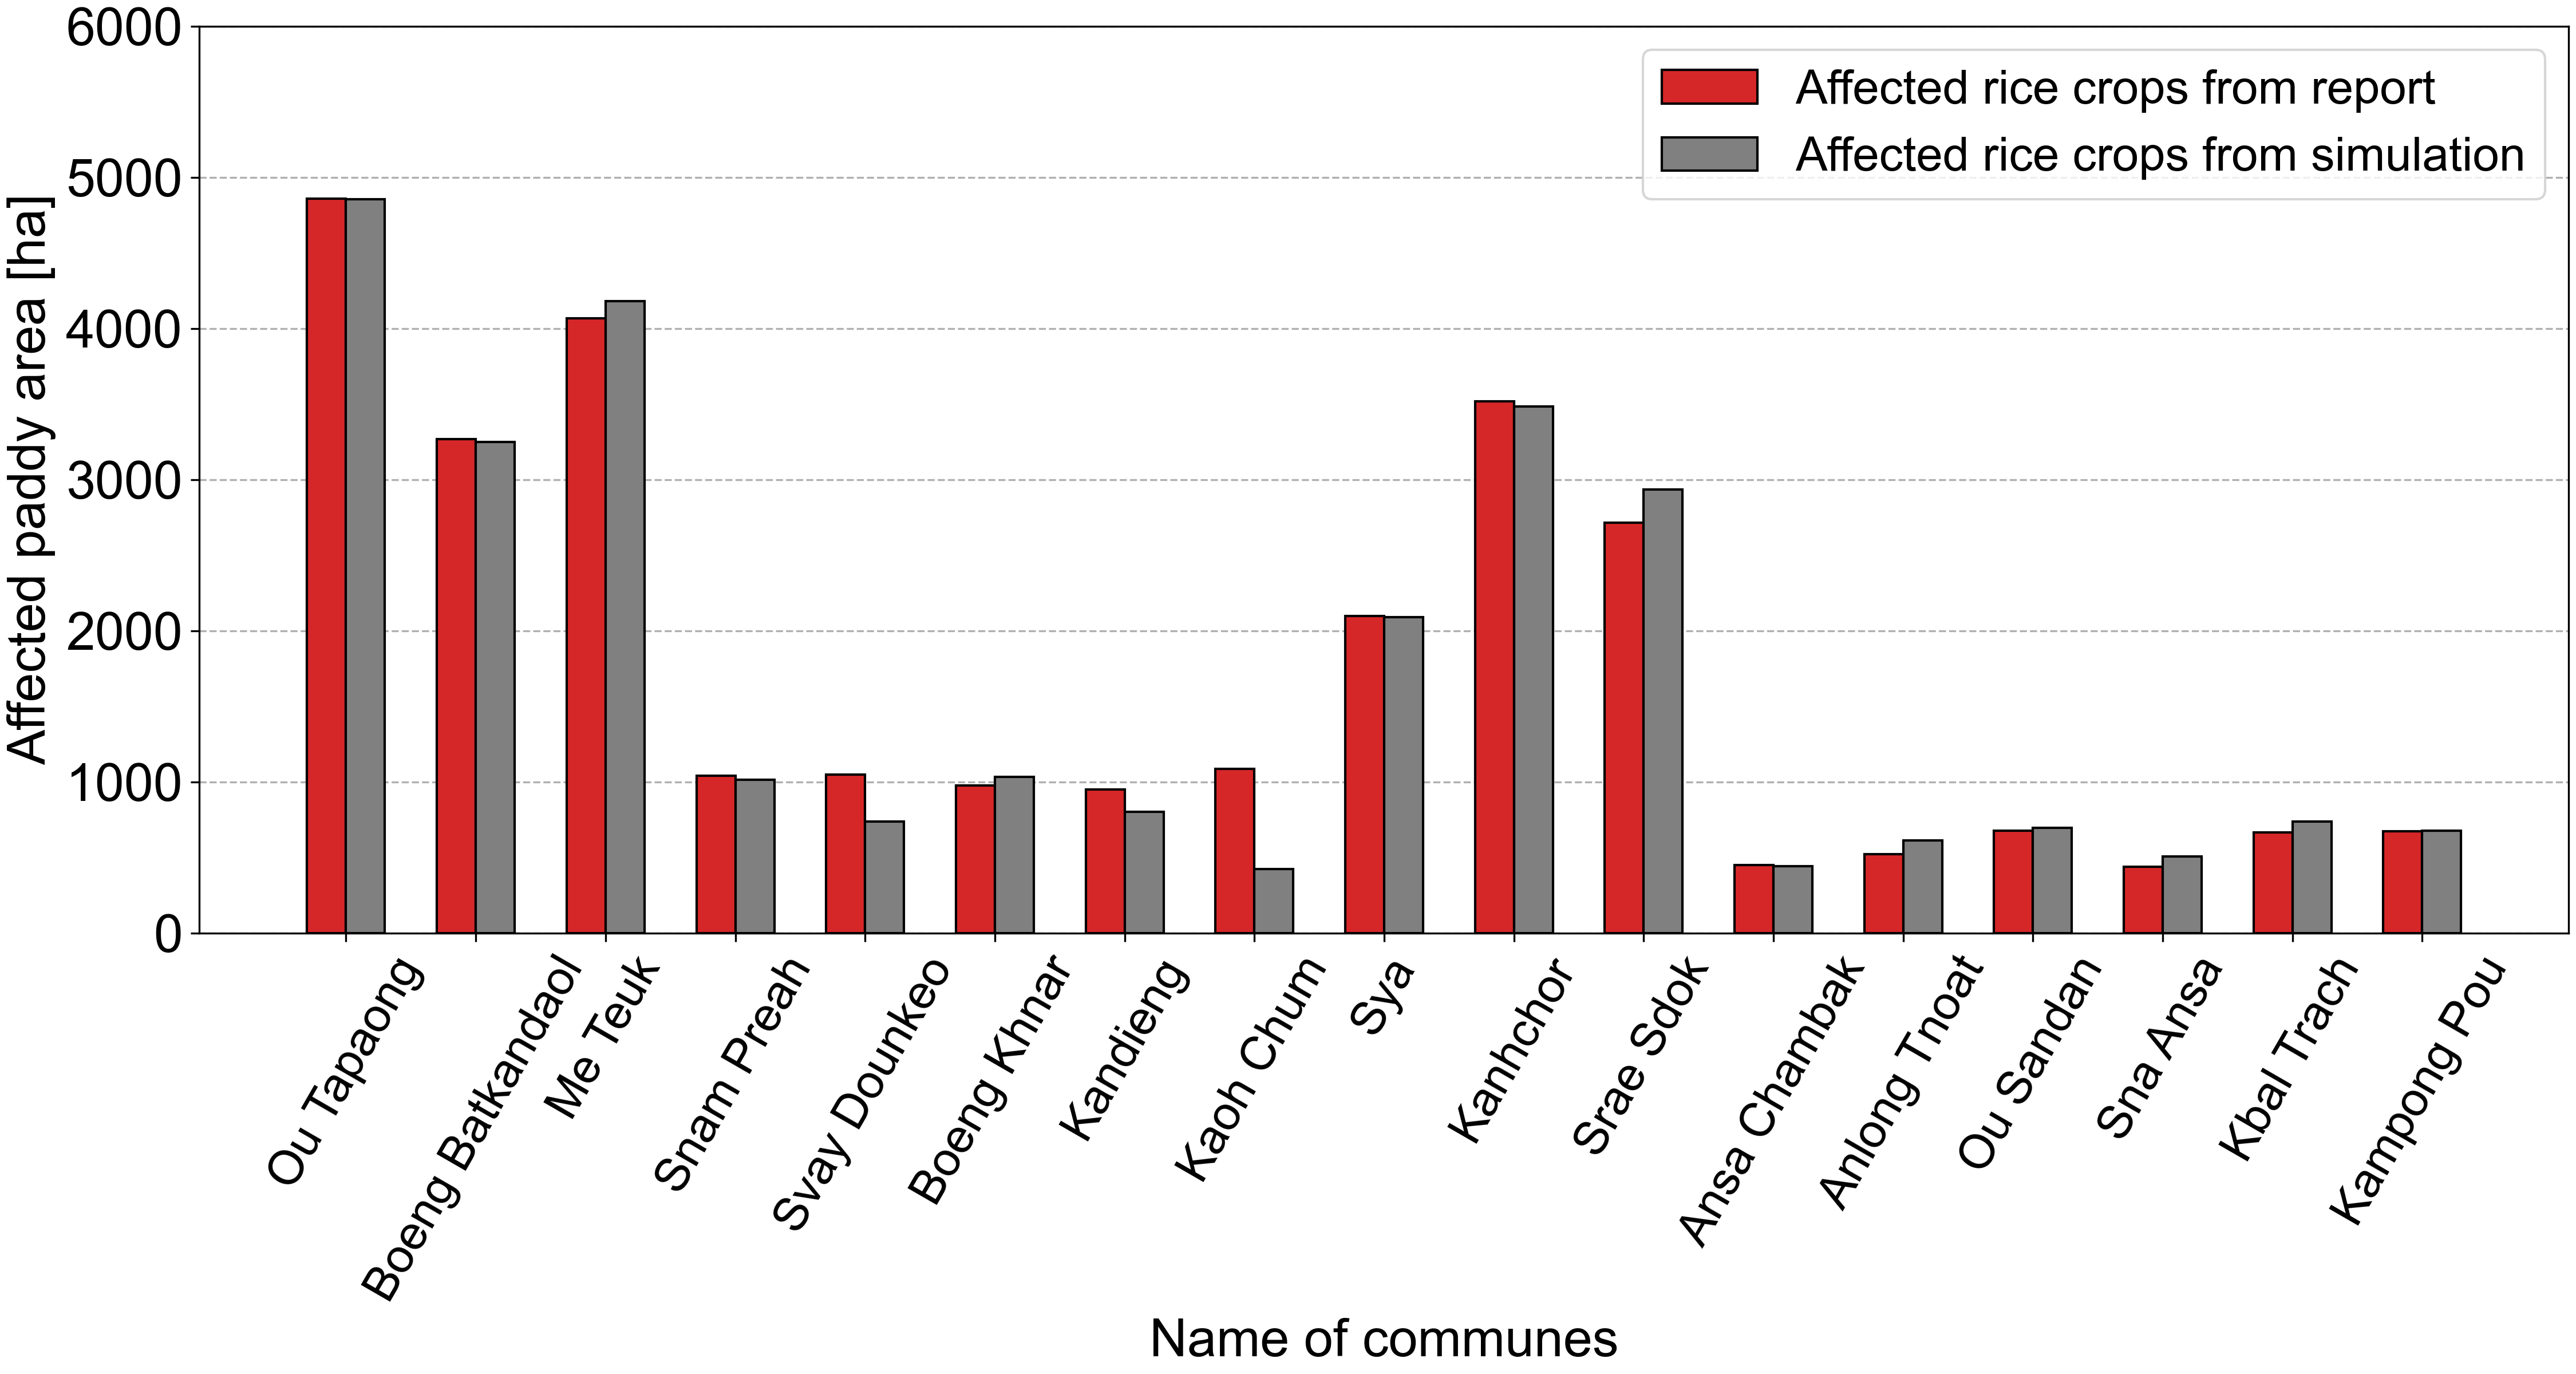
Here I will show how to plot side-by-side stacked line graph to show the comparison of reported and estimated affected rice crop area with the code written in Python Jupiter Notebook.
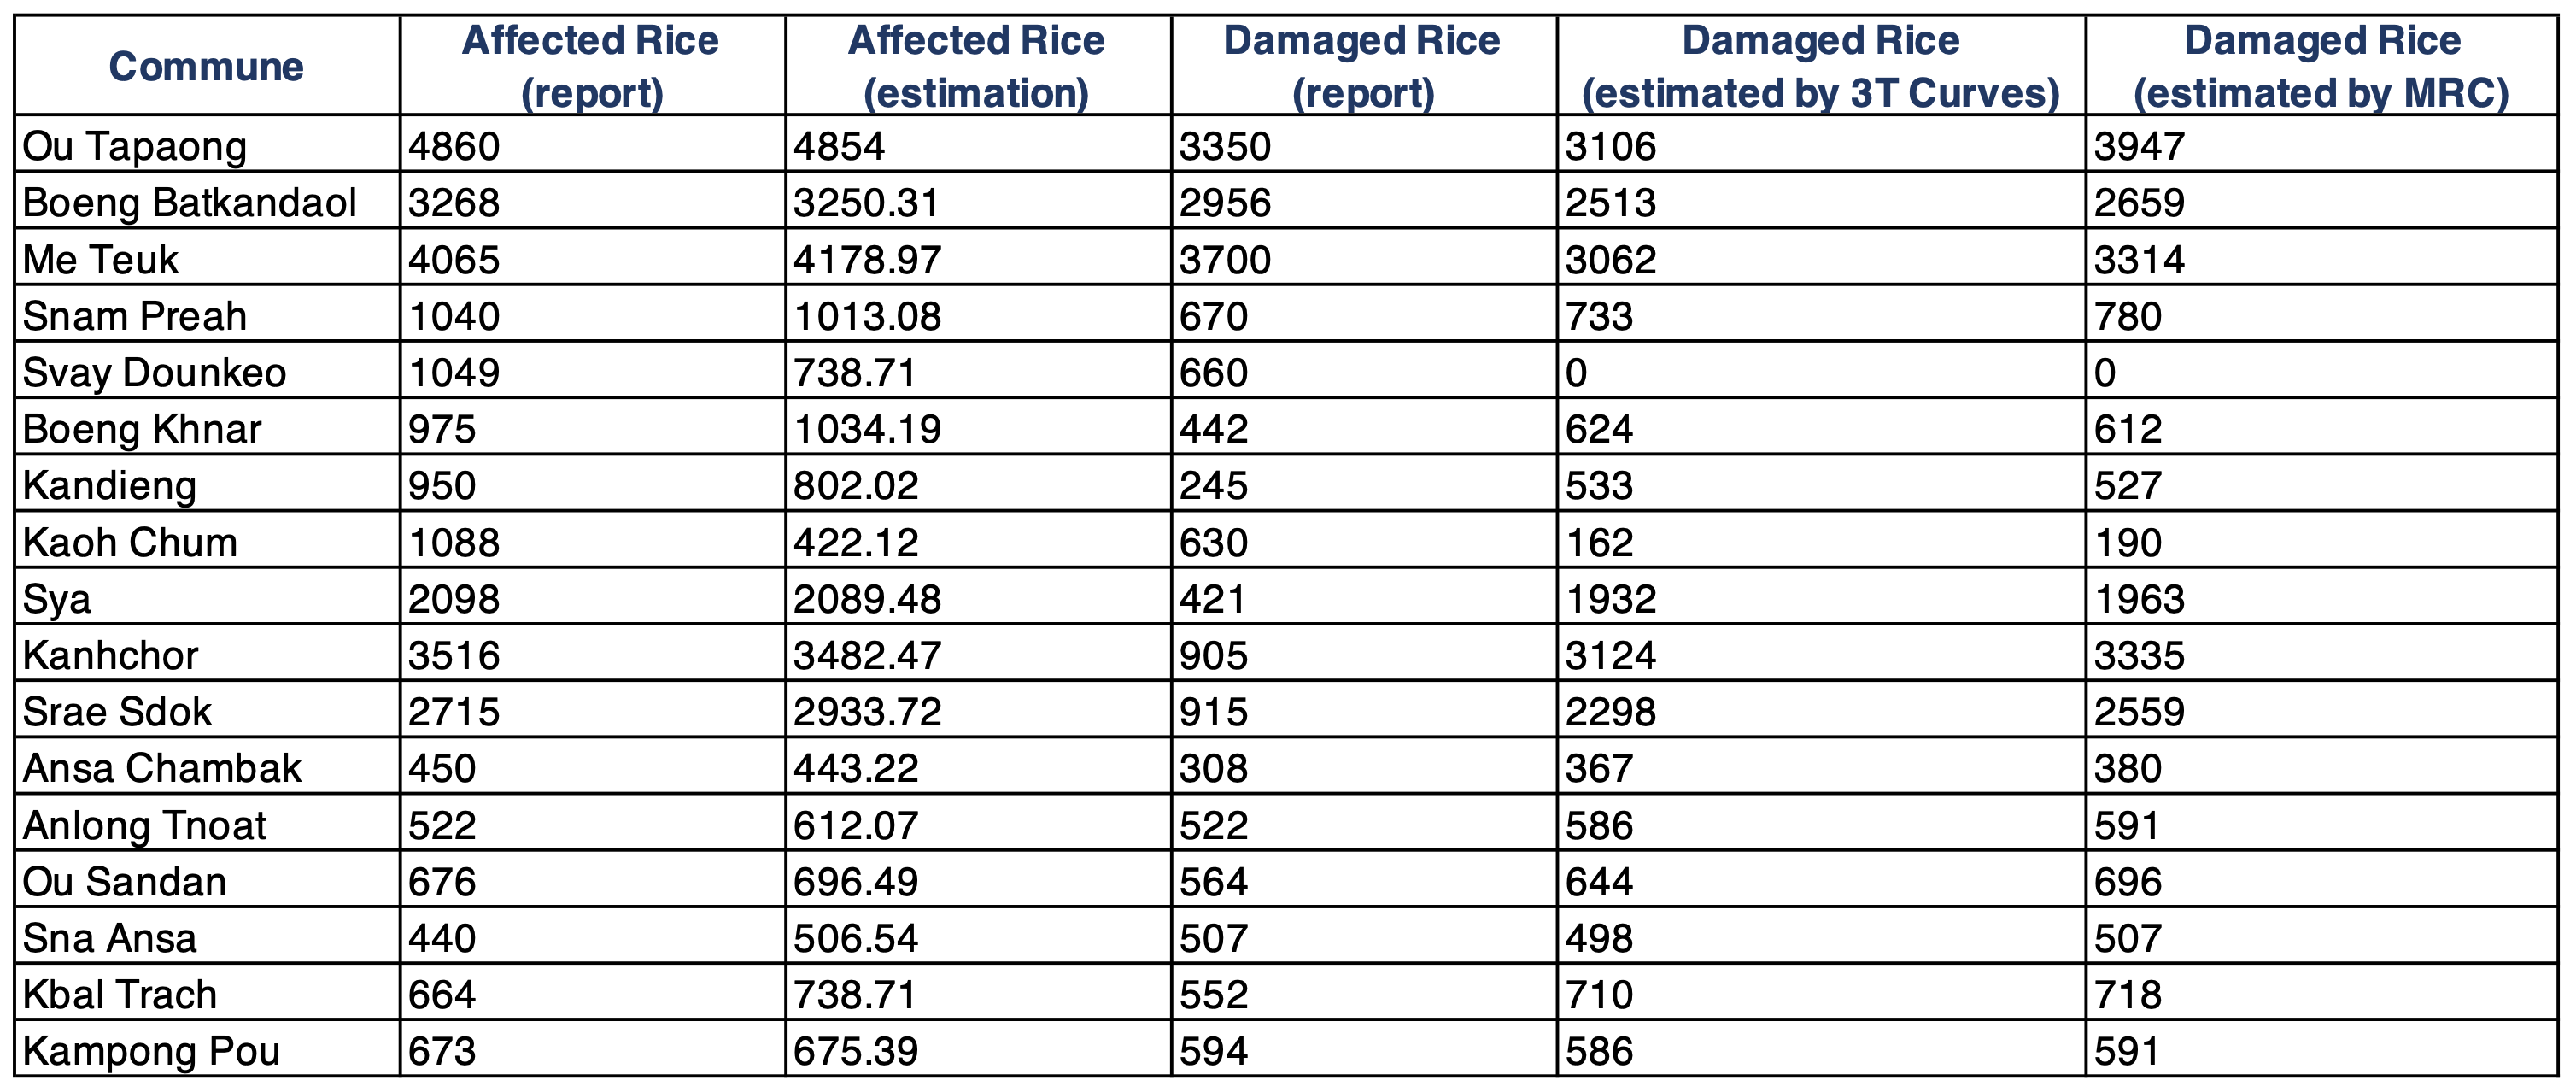
1. Data Table
Data source name: data_table.csv

2. Code
---
import matplotlib.pyplot as plt
import numpy as np
import pandas as pd
from matplotlib import rc

# set font type
plt.rcParams["font.family"] = "Arial"

# import data table
df = pd.read_csv('data_table.csv')

# assign values
xl = np.arange(len(df))
comm = df.iloc[:,0]
aff_rp = df.iloc[:,1]
aff_est = df.iloc[:,2]
dm_rp = df.iloc[:,3]
dm_3t = df.iloc[:,4]
dm_mrc = df.iloc[:,5]

# create plot
plt.figure(figsize=(15,8),constrained_layout=True)
plt.rc('font', size=20)
plt.rc('xtick', labelsize=20)
plt.rc('ytick', labelsize=22)
plt.rc('axes', labelsize=22)
bar_width = 0.3

plt.grid(which='major',linestyle='--', axis = 'y')
plt.bar(xl, aff_rp,width = bar_width, color = 'tab:red', edgecolor = 'black', label='Affected rice crops from report', zorder = 2)
plt.bar(xl+bar_width, aff_est,width = bar_width, color = 'gray', edgecolor = 'black', label='Affected rice crops from simulation', zorder = 2)
plt.xticks(xl+0.15, comm, rotation = 60)

plt.ylabel('Affected paddy area [ha]', fontsize=22)
plt.xlabel('Name of communes', fontsize=22)
plt.ylim(0,6000)
plt.legend(fontsize = 20)

plt.savefig('affected-rice.png', dpi = 300)
plt.show()
---
3. Plot

Source code is available at: GitHub


