Heavy rain lashed Cambodia for over two weeks in October 2020, flooding 18 provinces and Phnom Pench city. According to figures reported by National Committee for Disaster Management (NCDM) in Cambodia from 1st to 19th October, 25 people were reported dead in the floods, about 300,000 people or 78,000 families were affected, and about 37,000 people or 9,000 families were displaced to safer zones. In addition, flood has also destroyed 56 houses and affected over 73,000 houses, while 568 schools were inundated. In this flood event, at least 80,000 ha crops and 210,000 ha paddy fields were inundated, whereas theirs damages has not been so far reported. On the other hand, many national and provincial roads were severely impacted by the effects of this prolonged flood.
Even though various data were collected and described in Figure 1 by NCDM, the area of flooding which shows the extend and location of flooding has remained unofficially published by any related institutions. Therefore, I would like to reveal a quick method to detect and extract the inundated area based on Sentinel-1 SAR GRD images by using Google Earth Engine in QGIS application. The objectives are as follows:
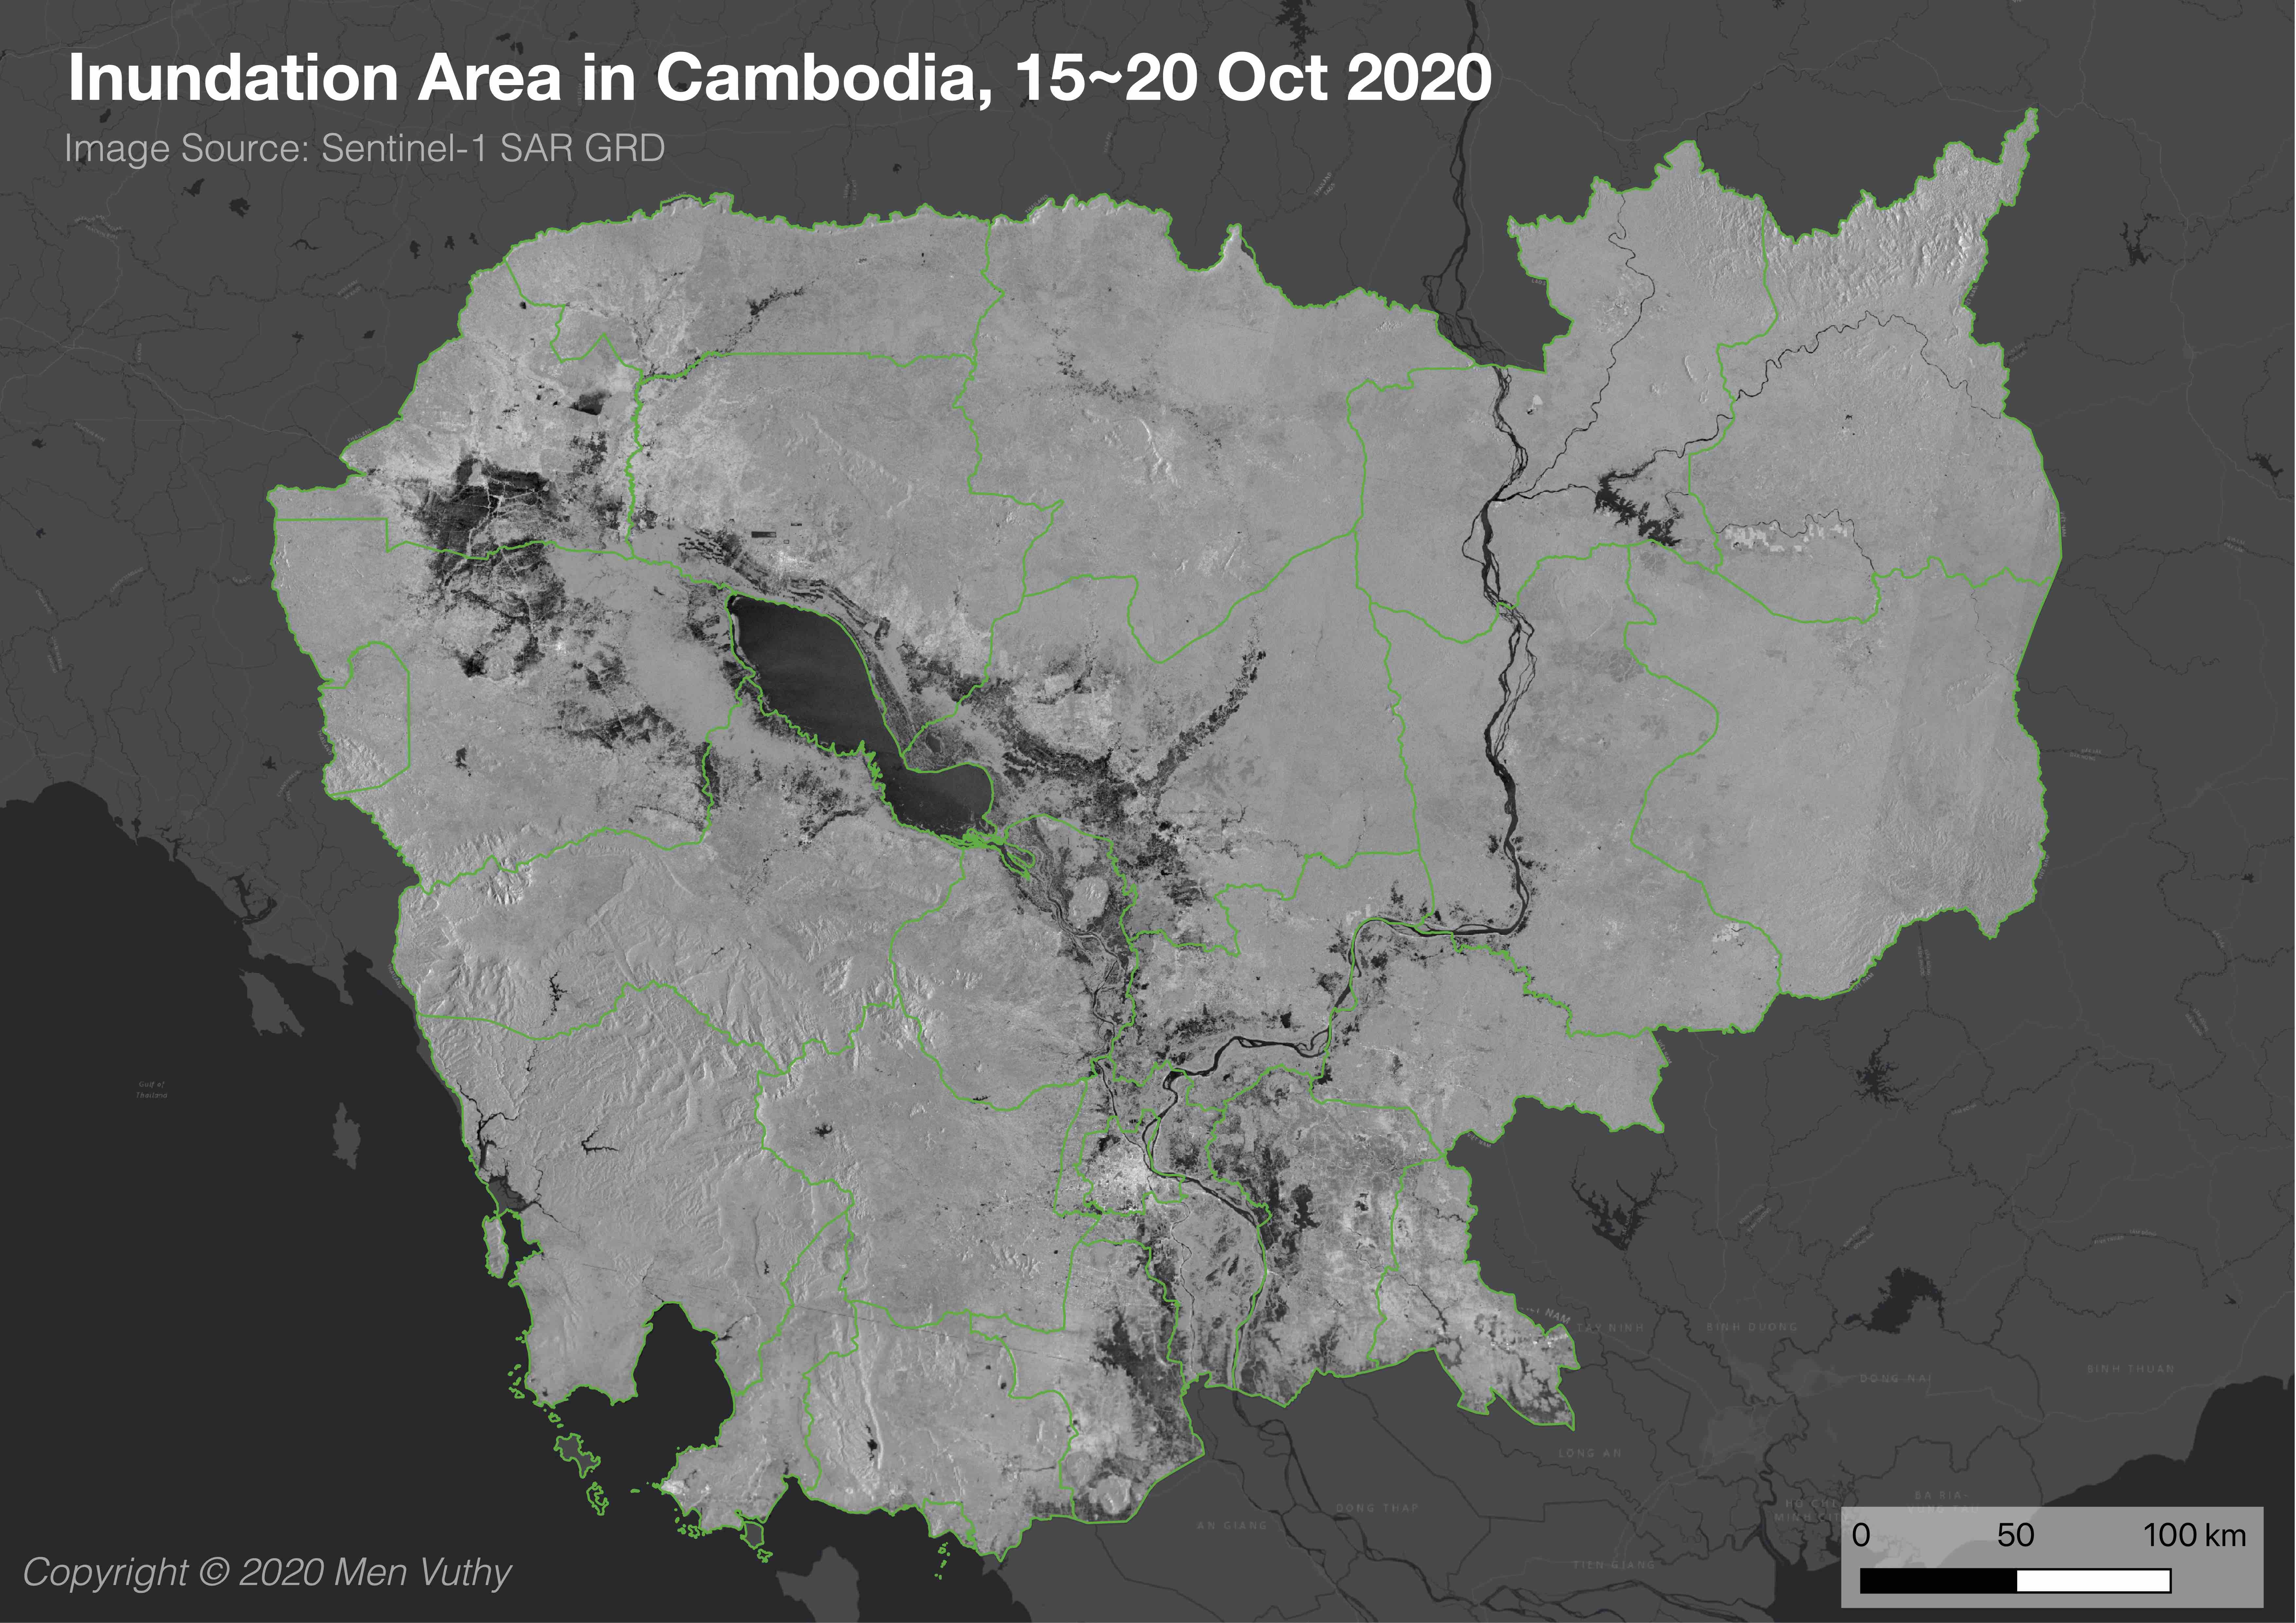
- Visualize the Sentinel-1 SAR GRD images of Cambodia from 15th to 20th October 2020 which is the most servere flooding period in the region.
- Detect inundation area in the images by setting a specific threshold value for waterbody.
- Extract and export the image of inundation area as a GeoTIFF or Raster format from the cloud storage of Google Earth Engine.
This map will serves practitioners, policy makers or engineers as an important information for developing strategy to effectively mitigate flood impact under uncertain climate in the future.
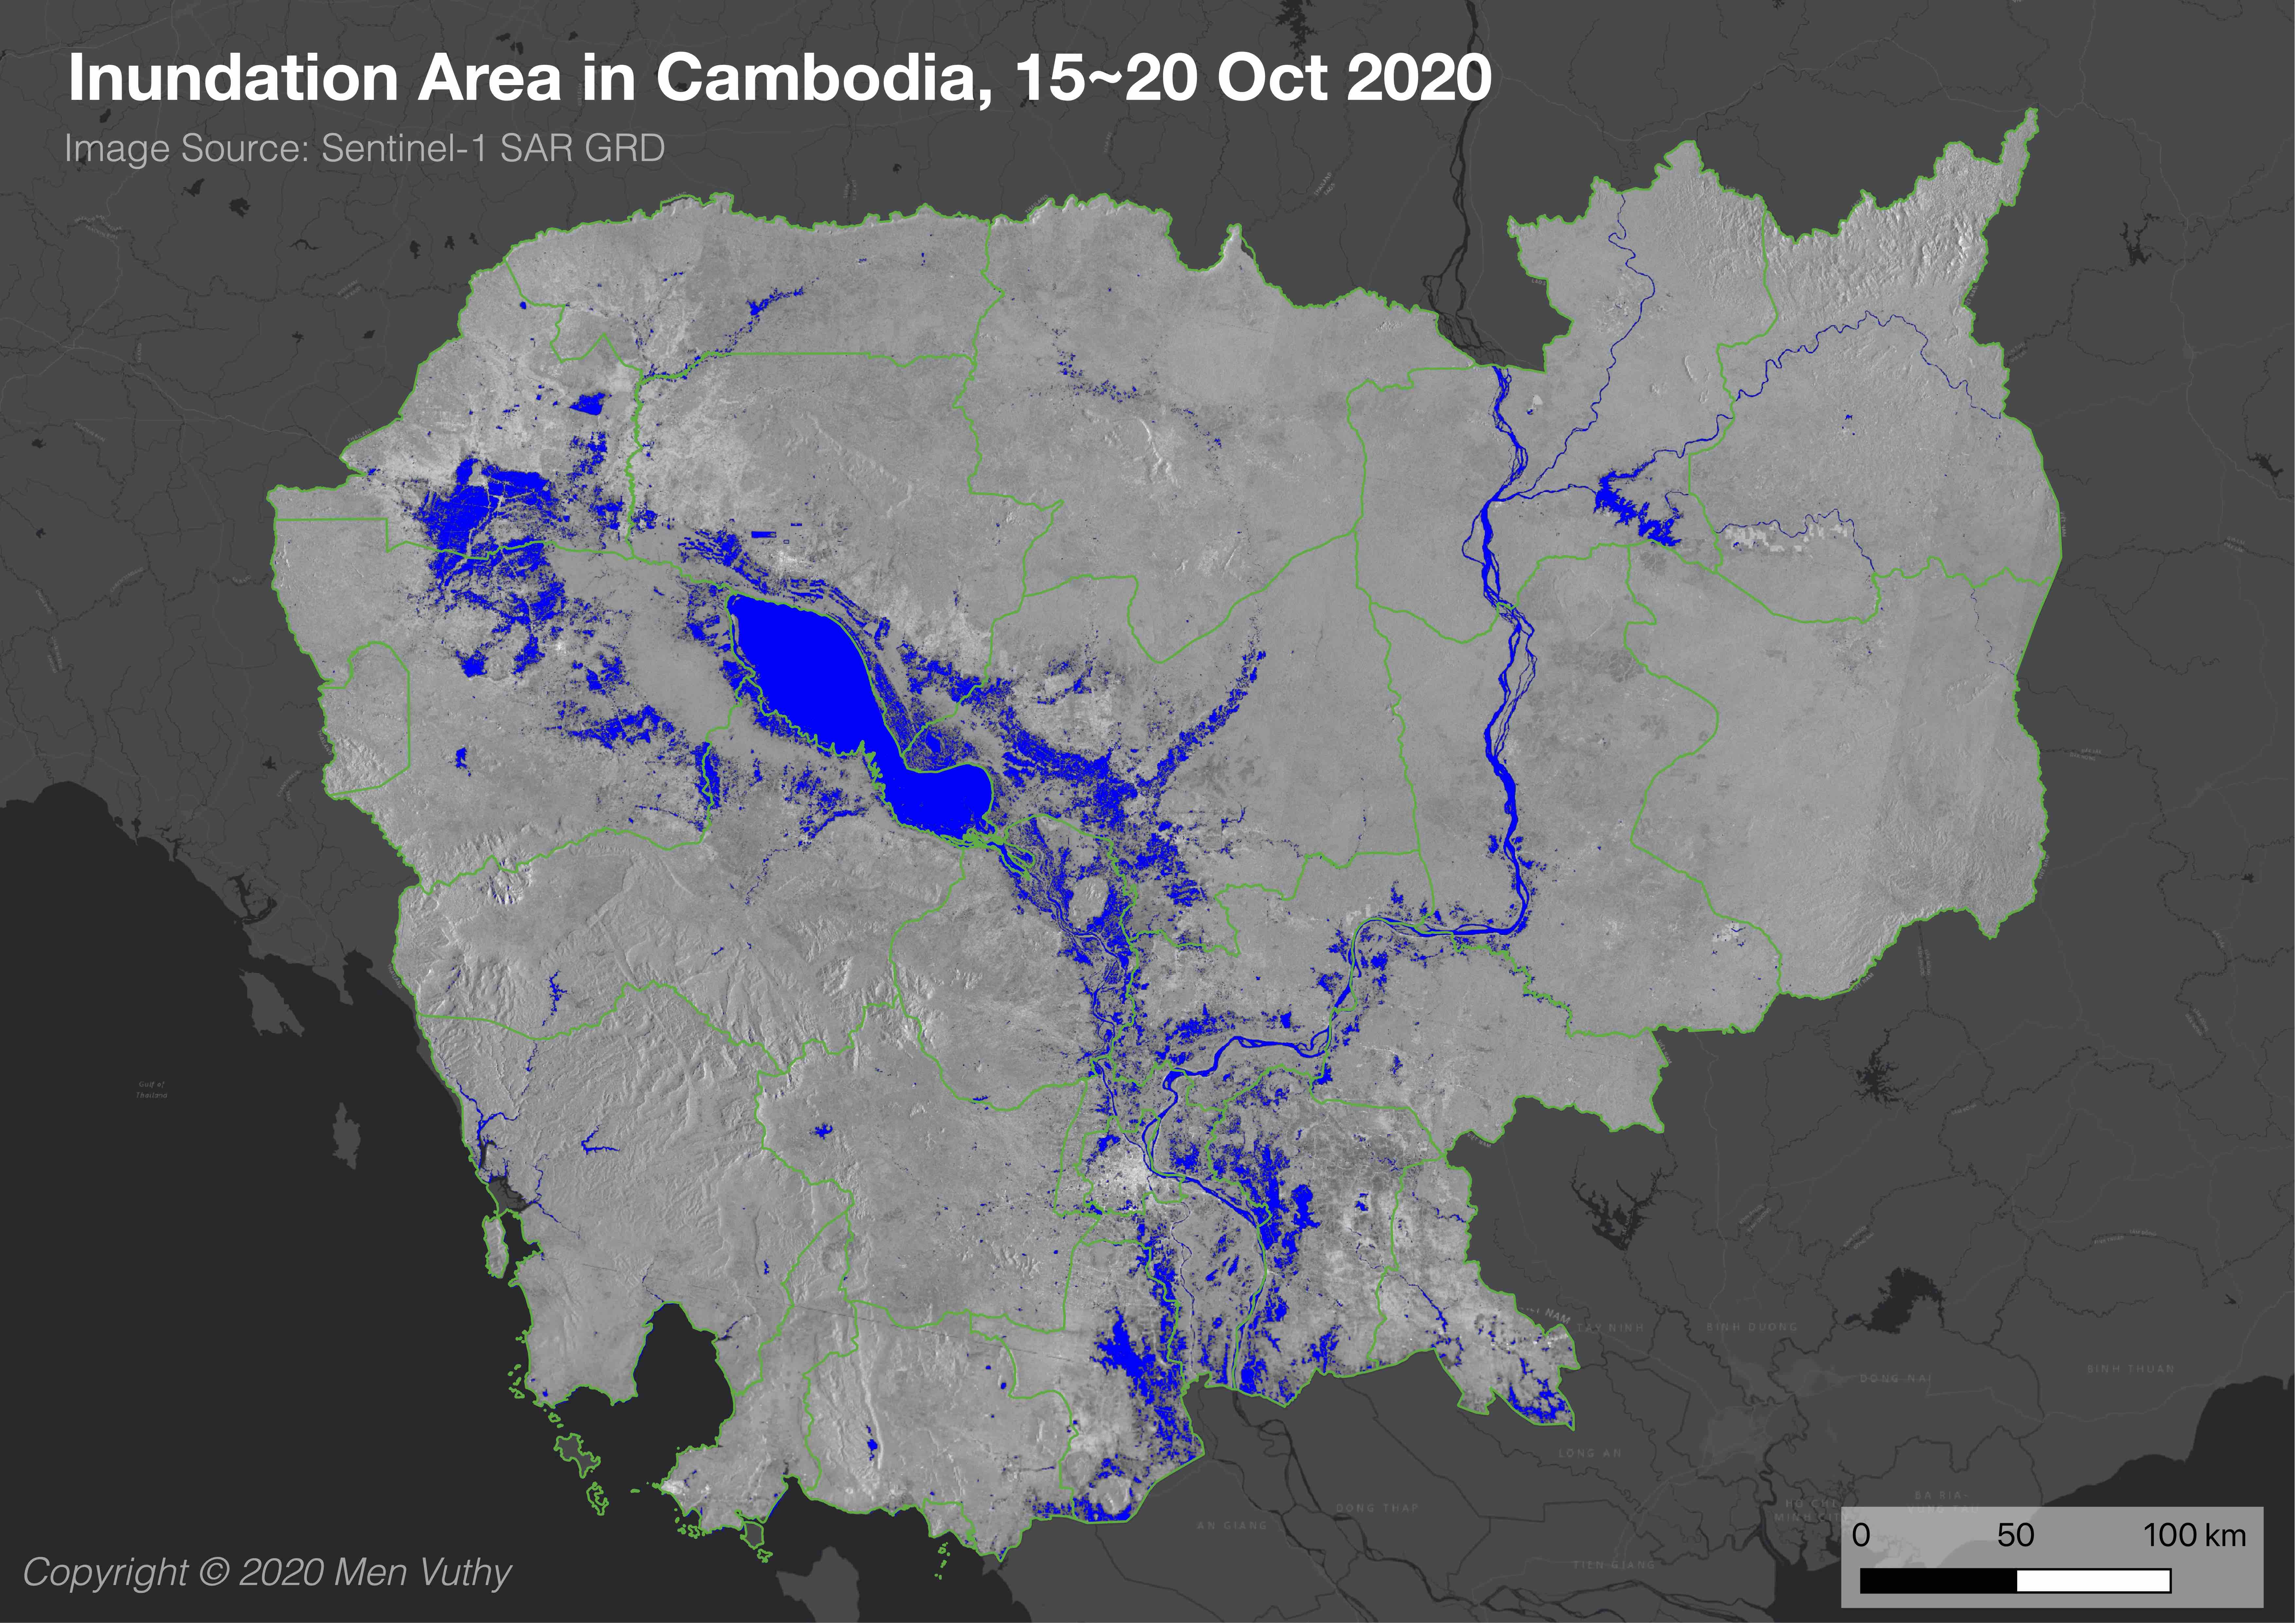
Overview of Inundation Area in Cambodia
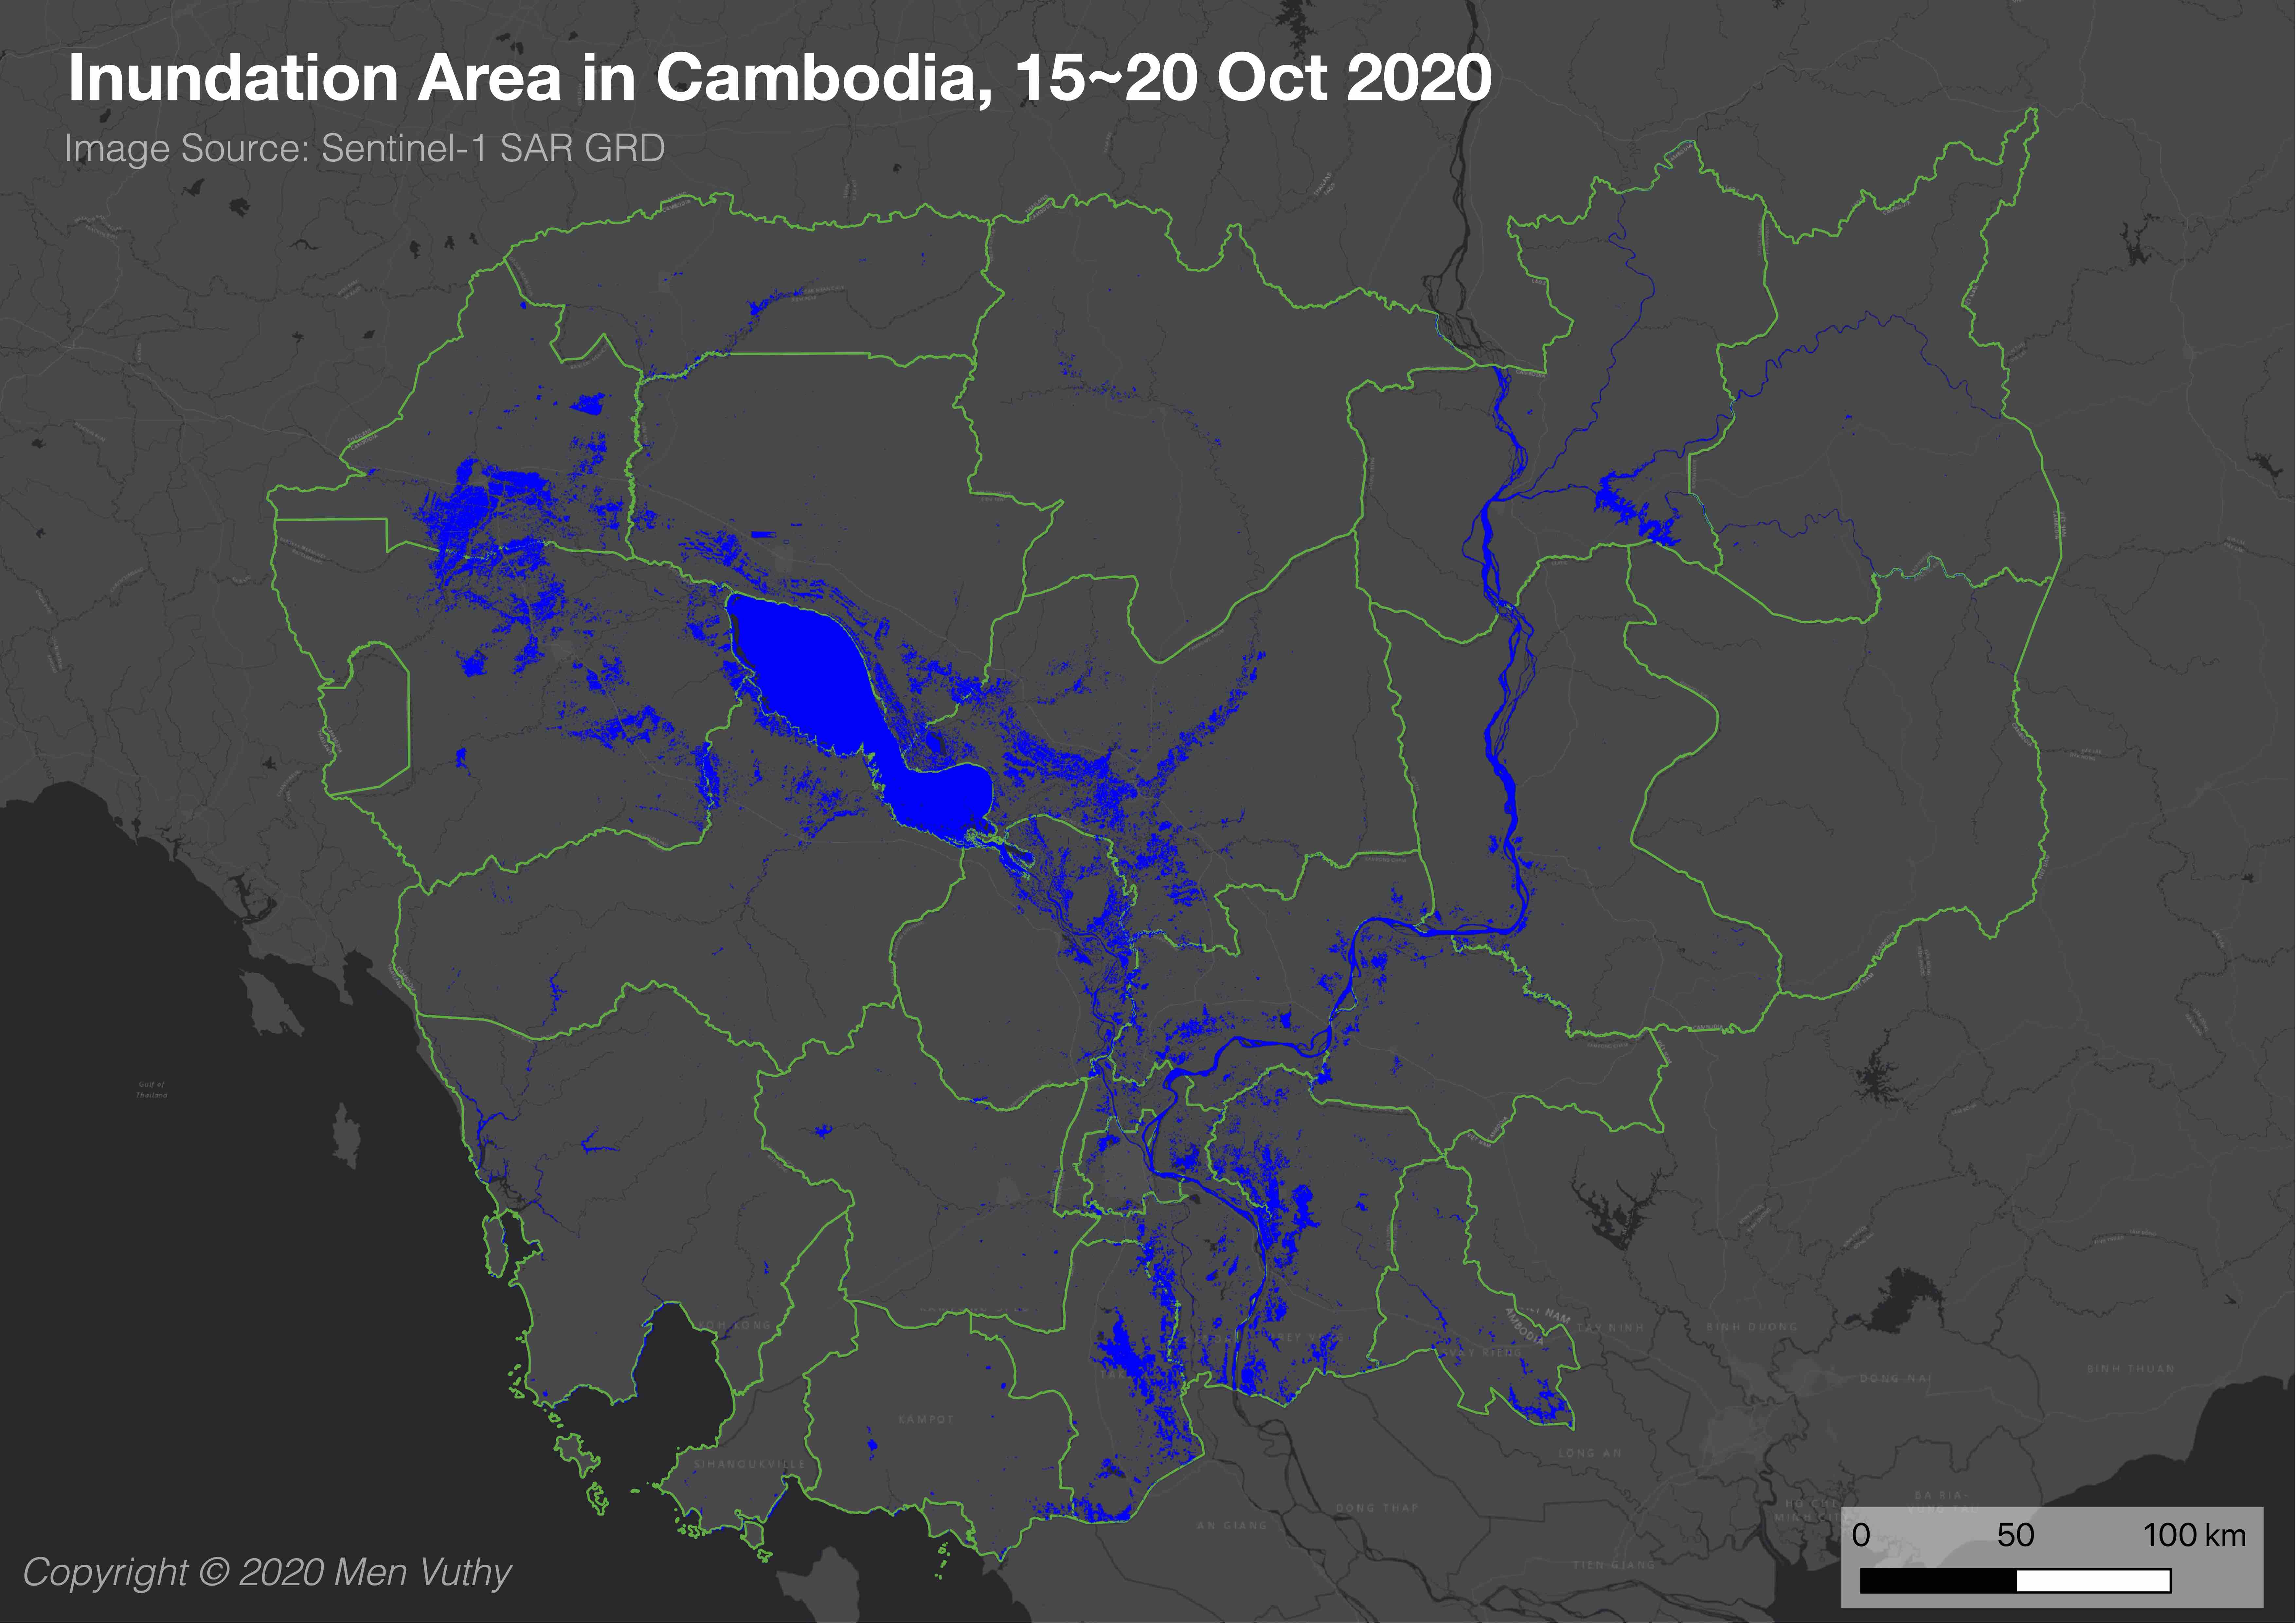
Overview of Inundation Area by City and Provinces
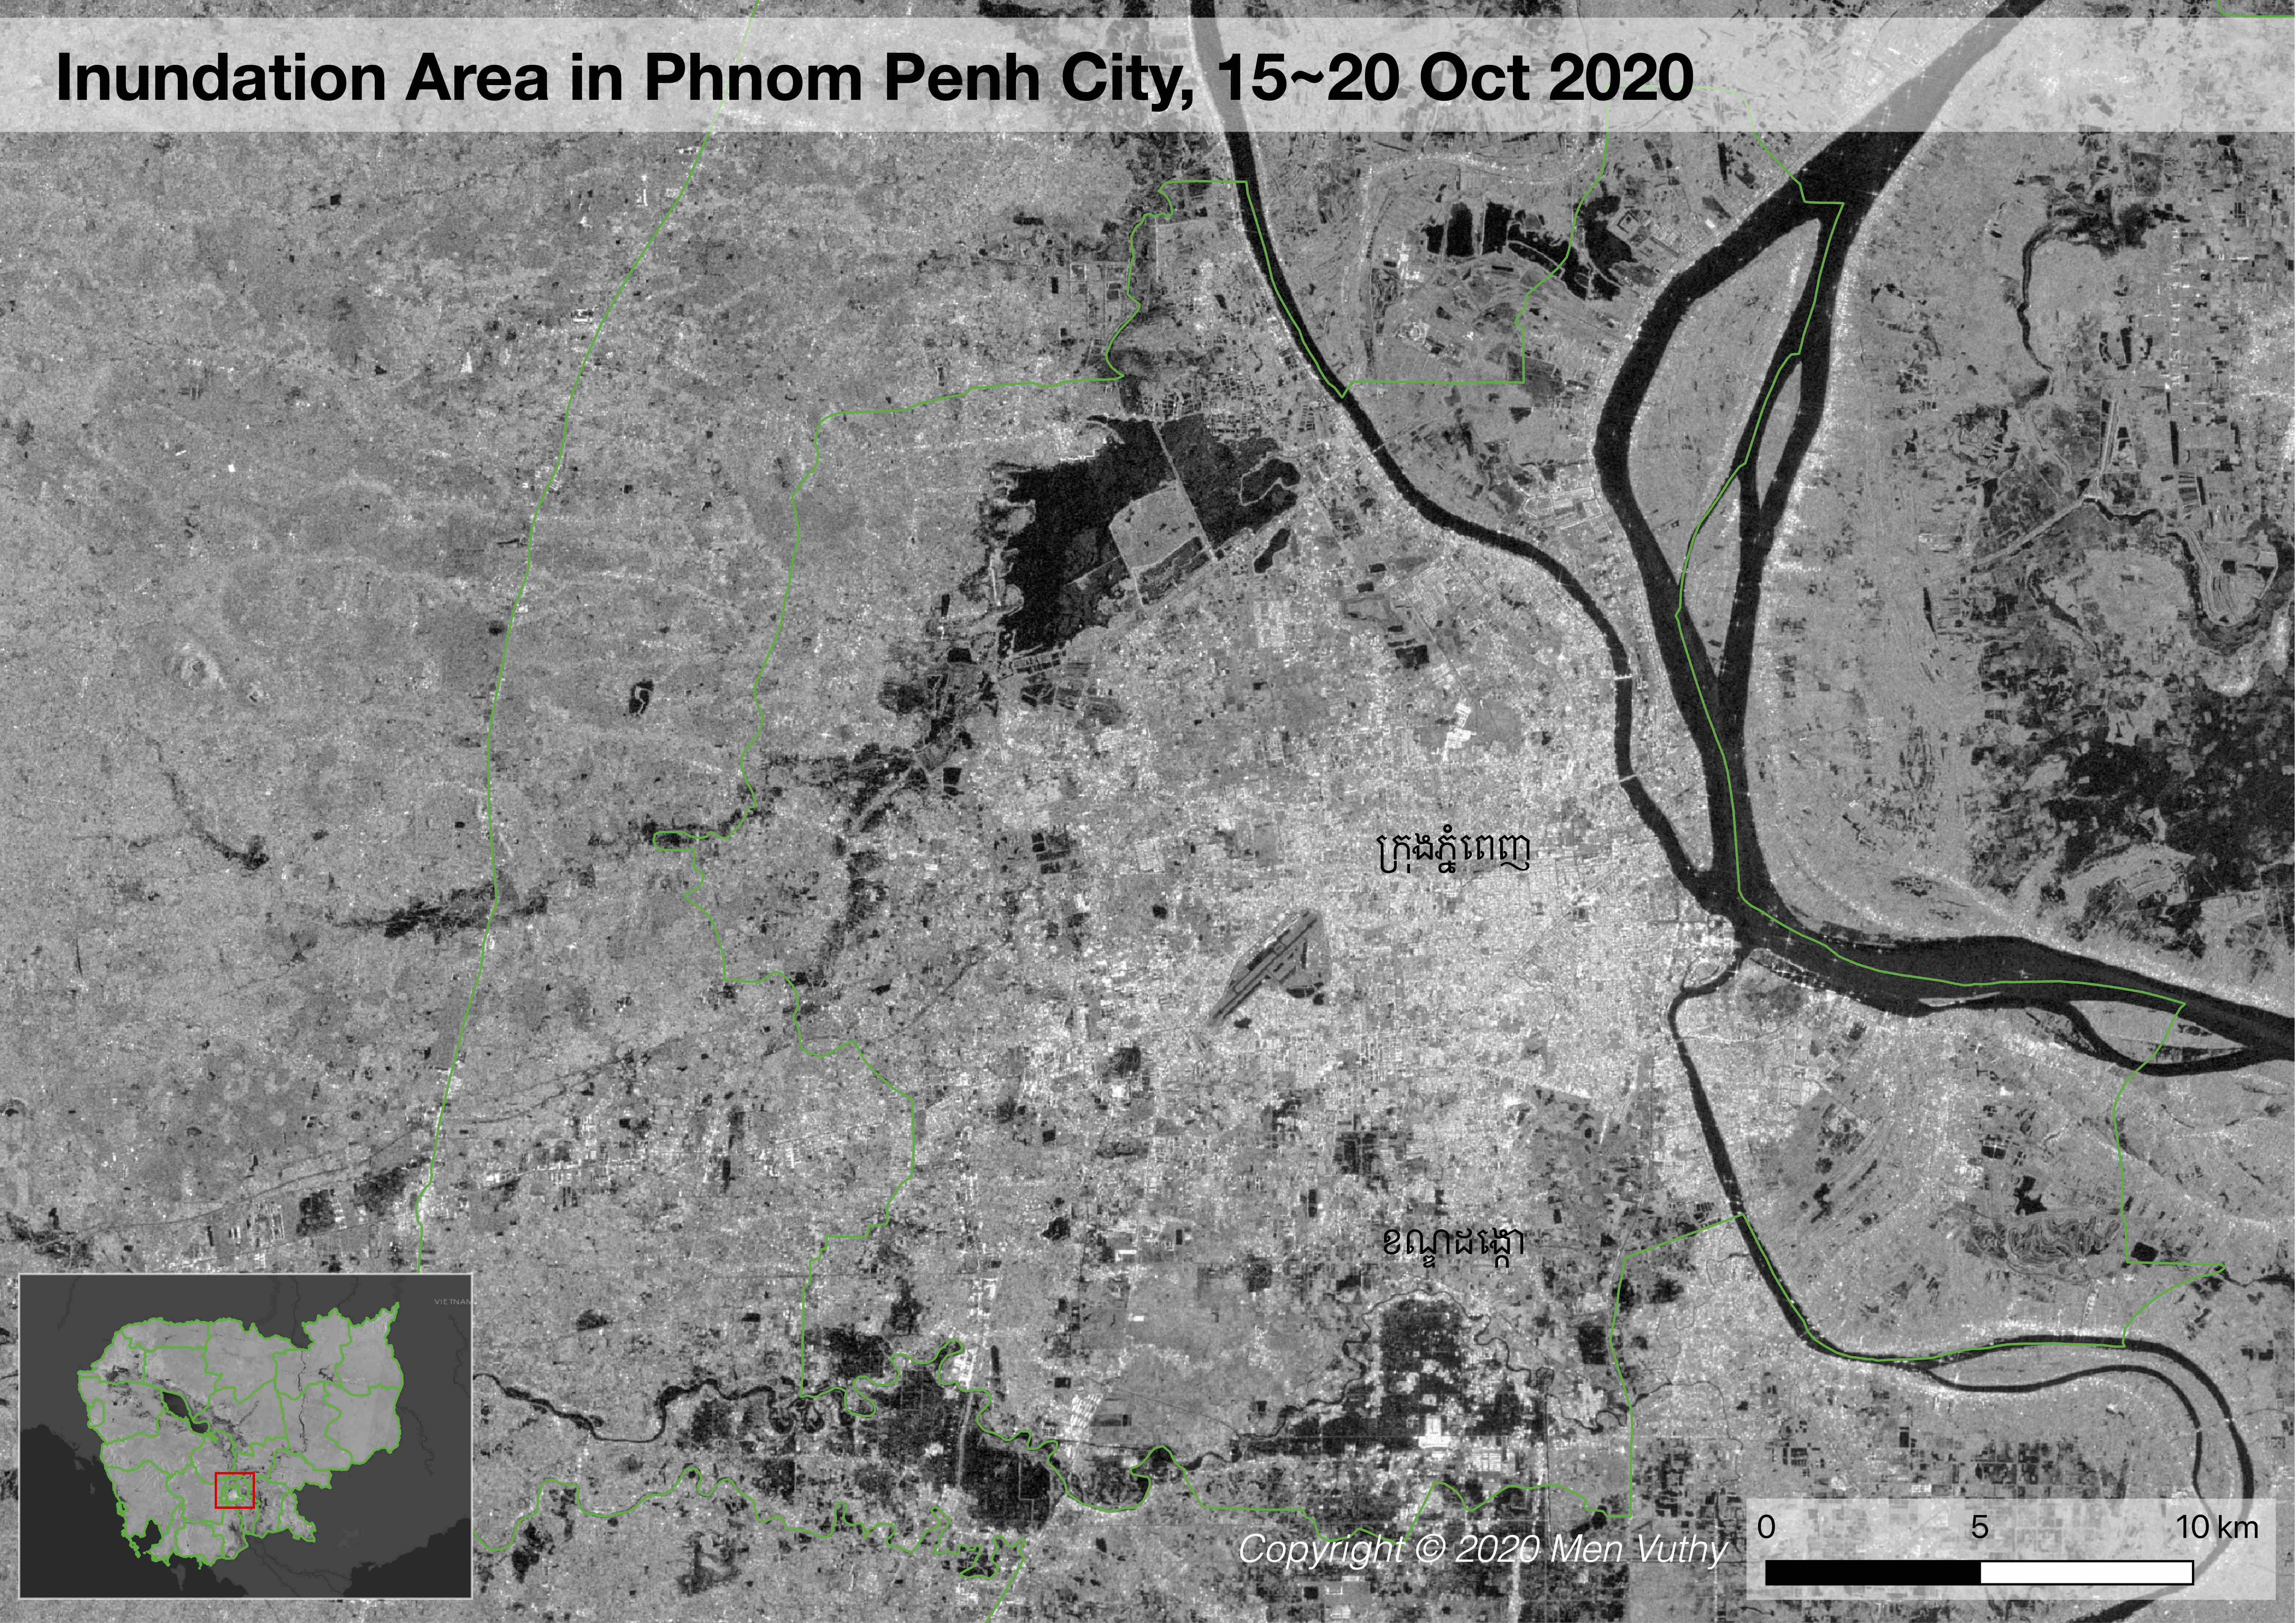
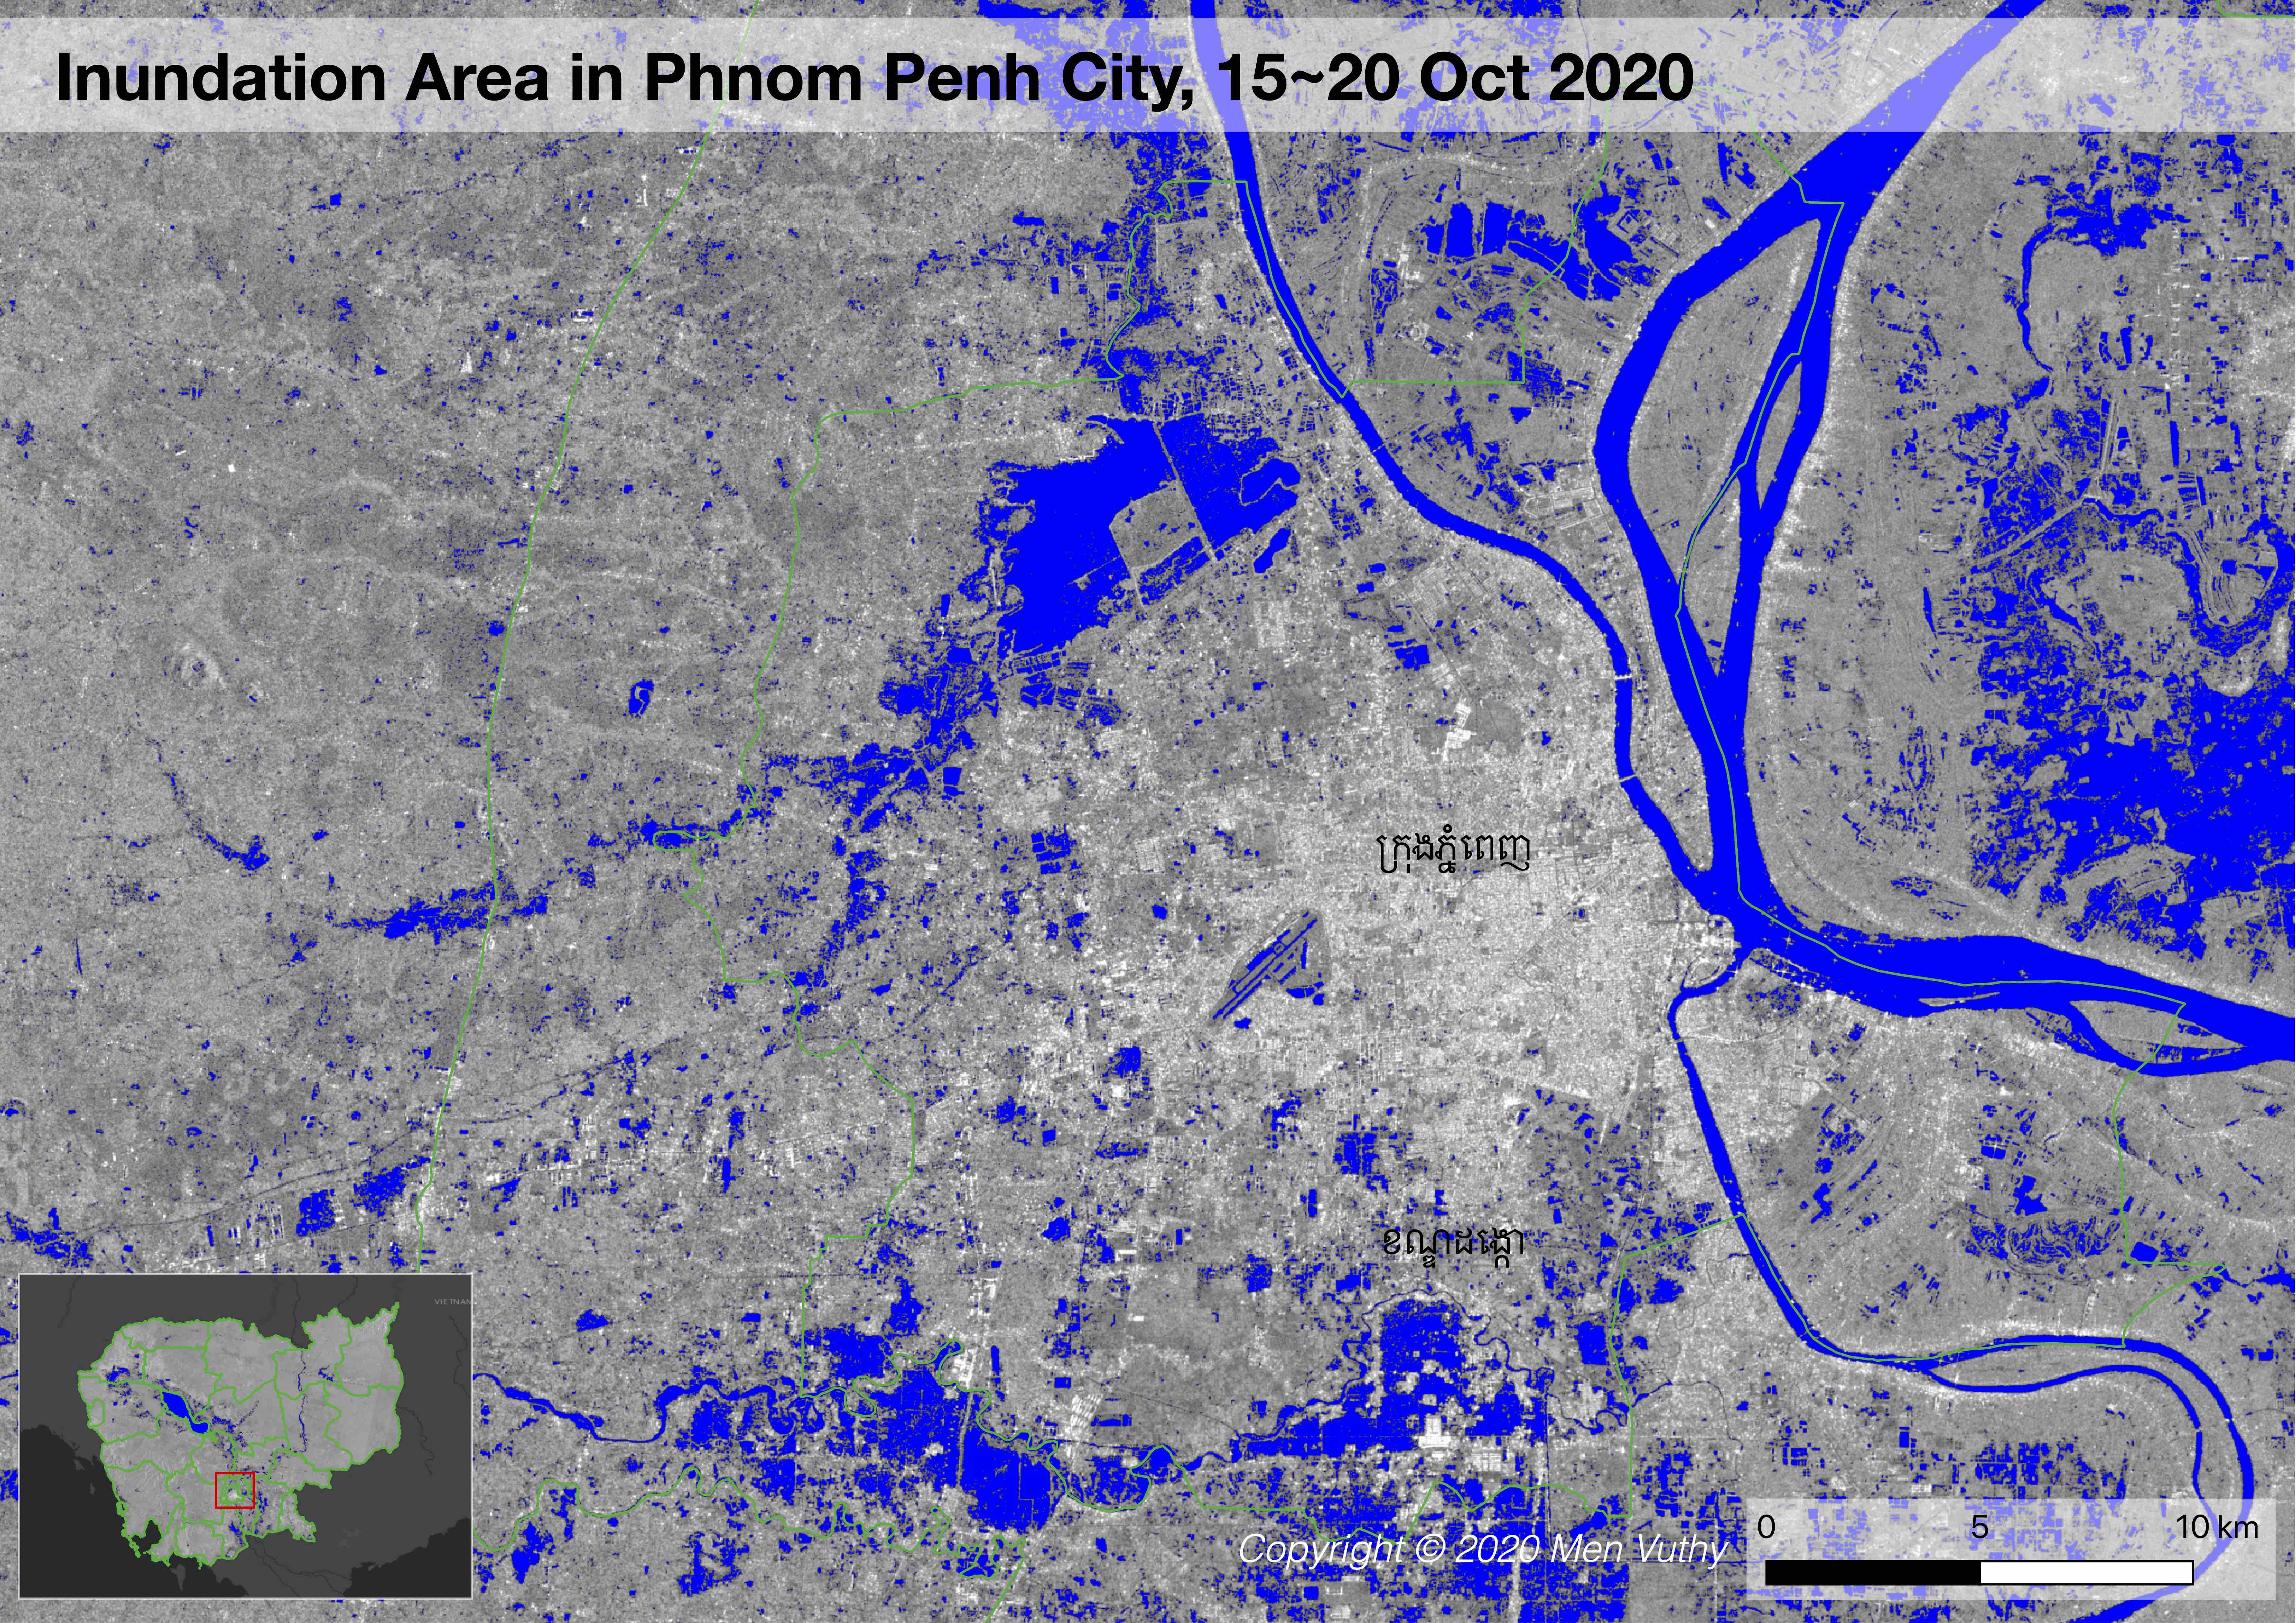
Phnom Penh City
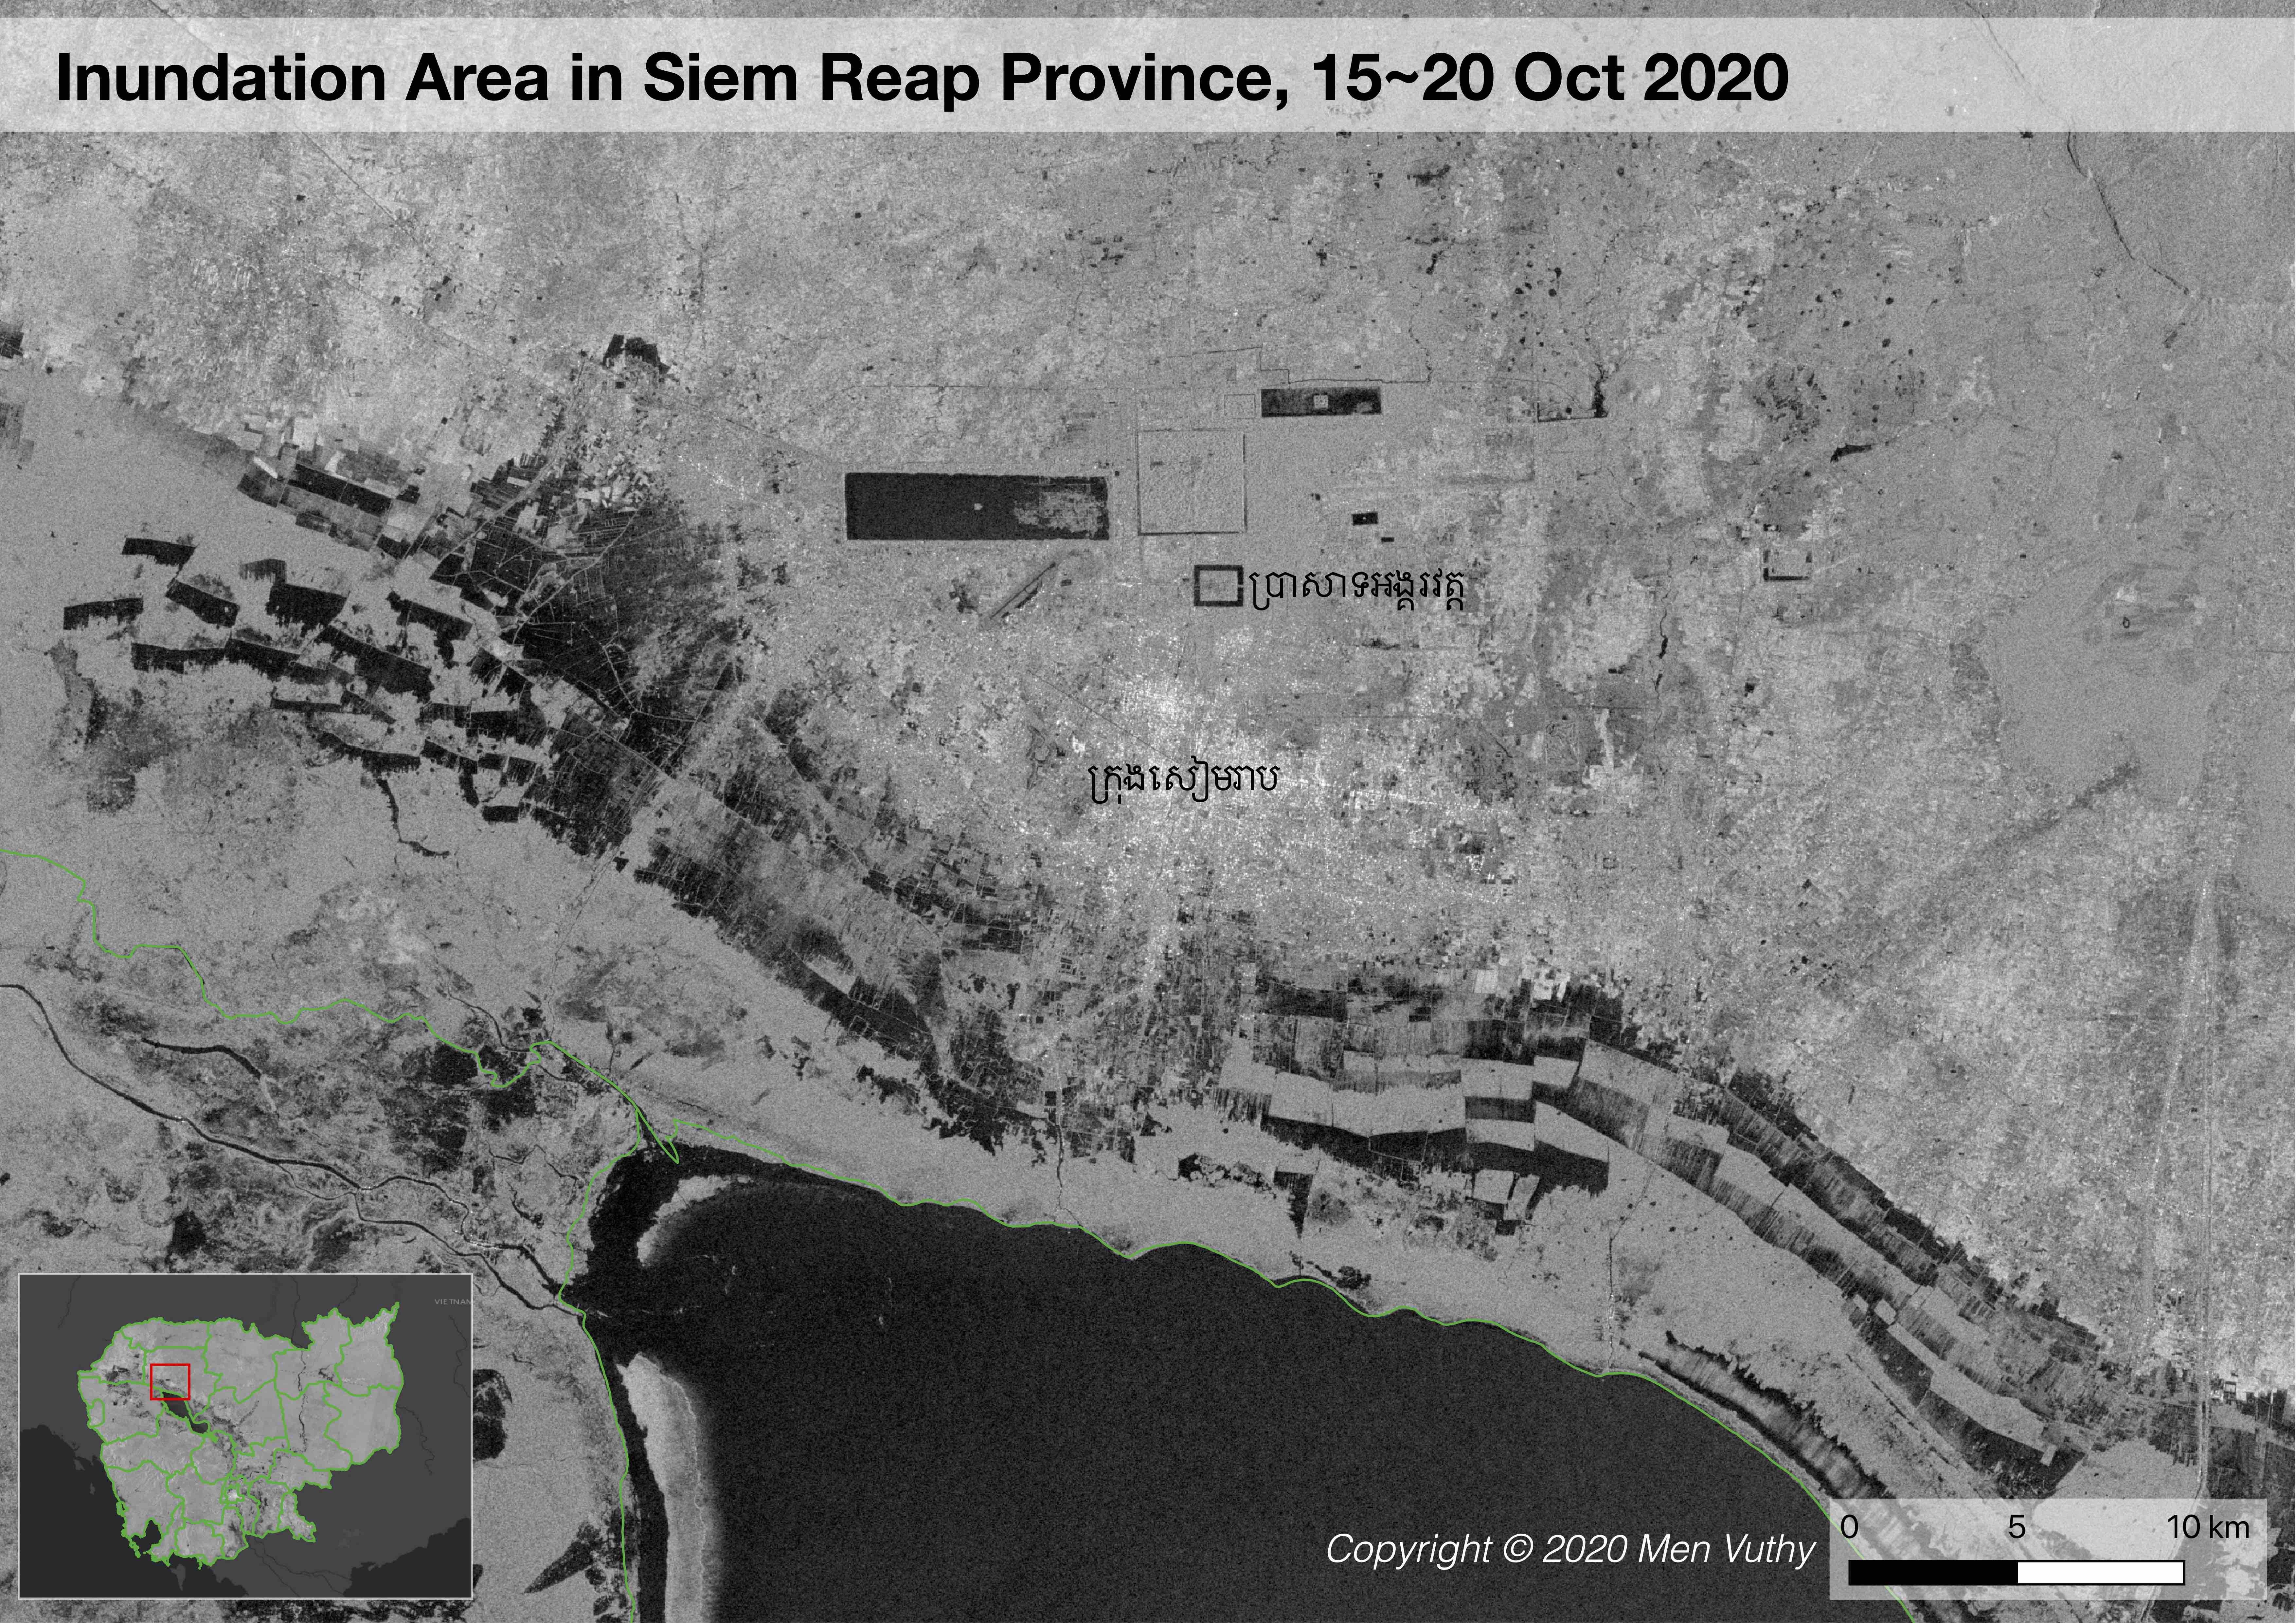
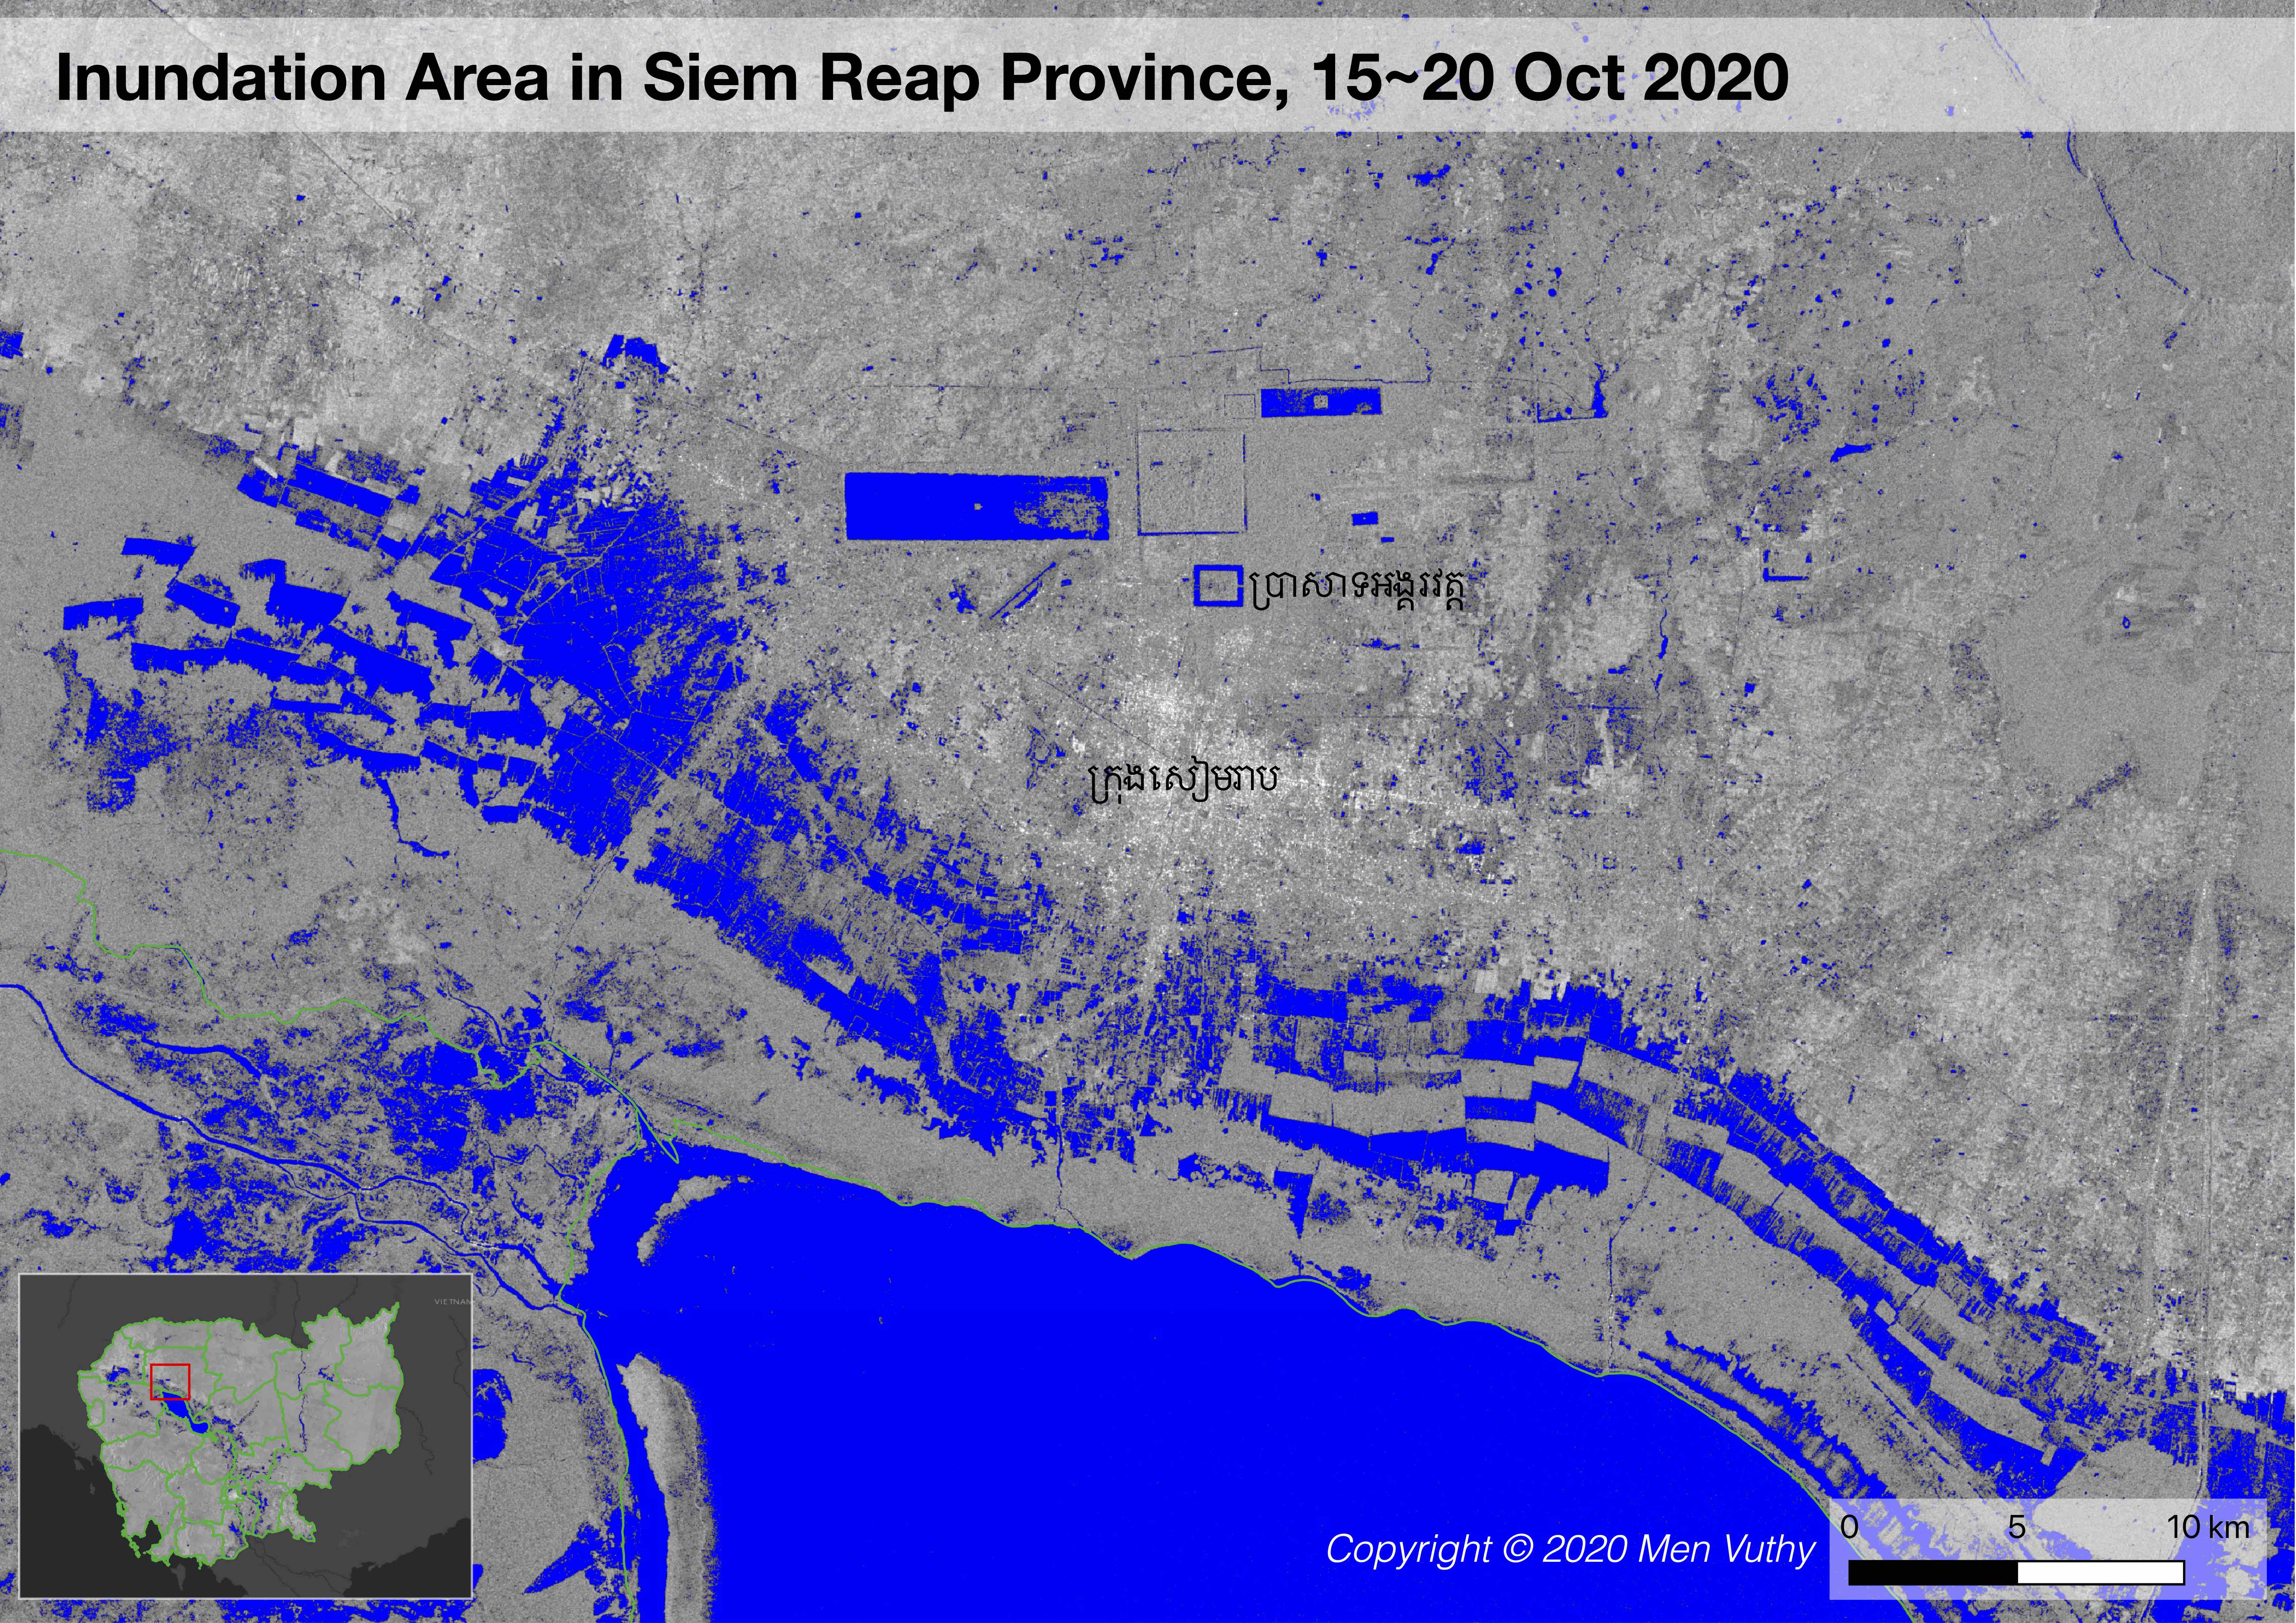
Siem Reap
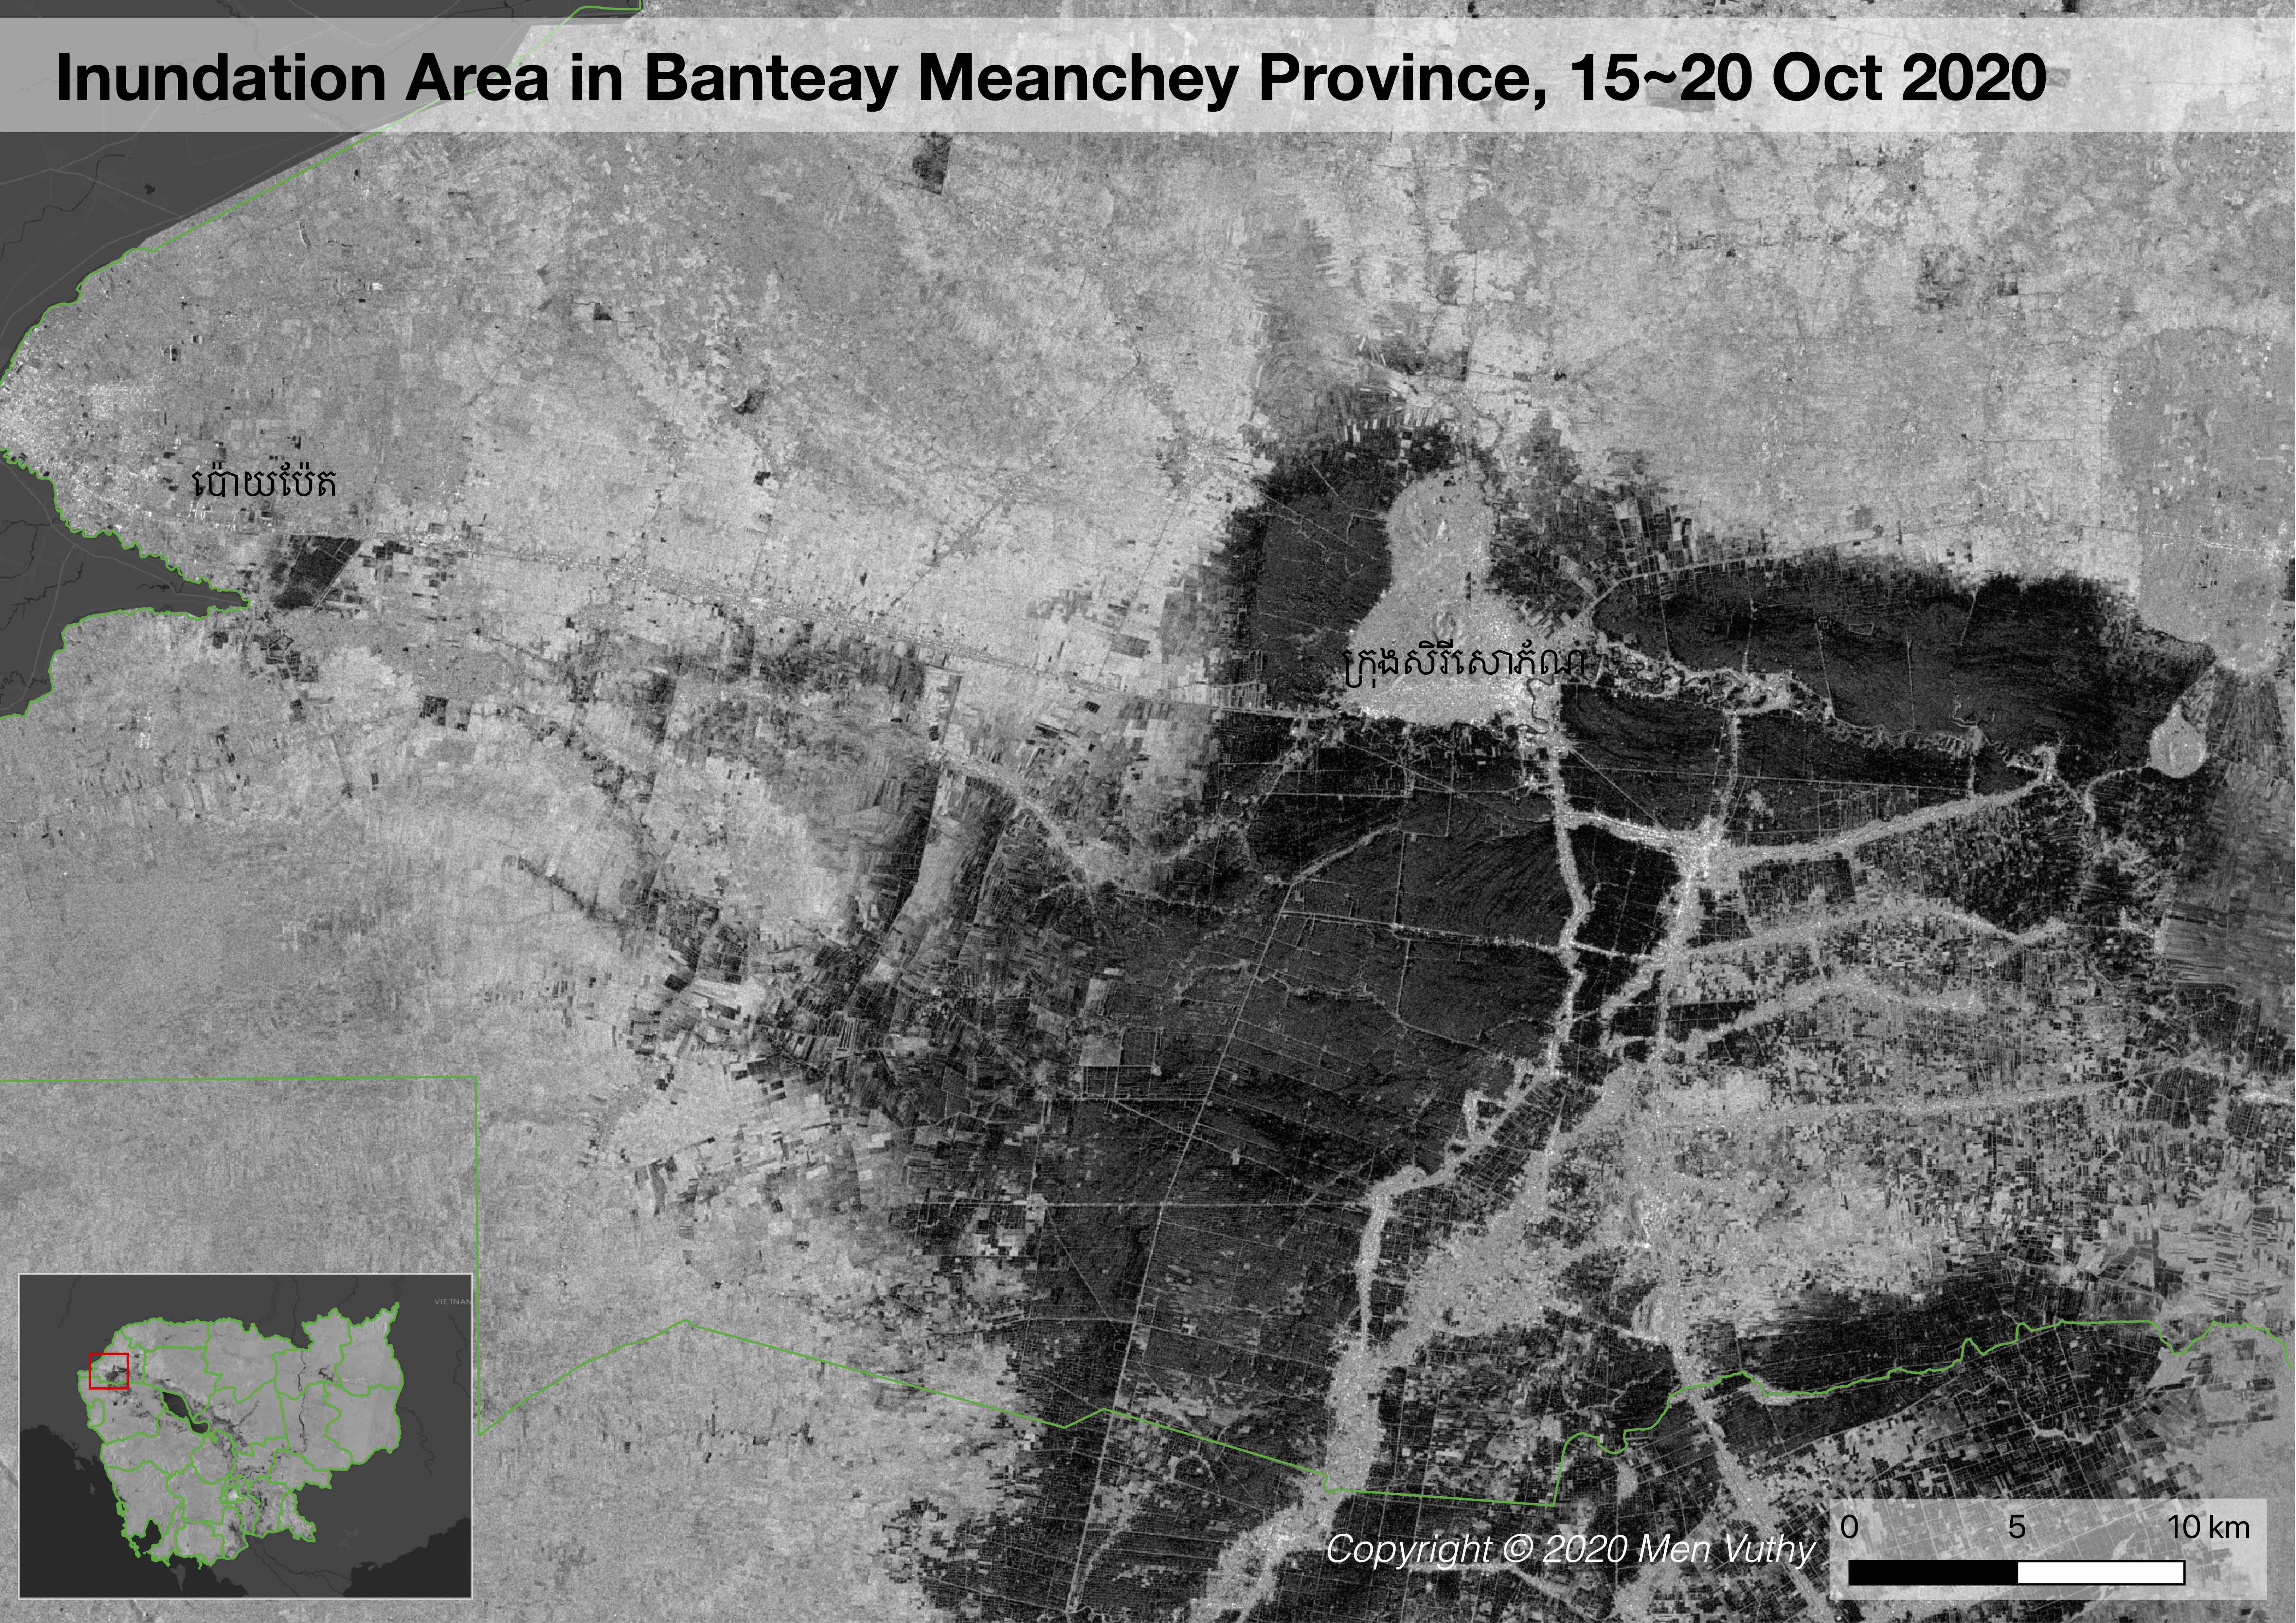
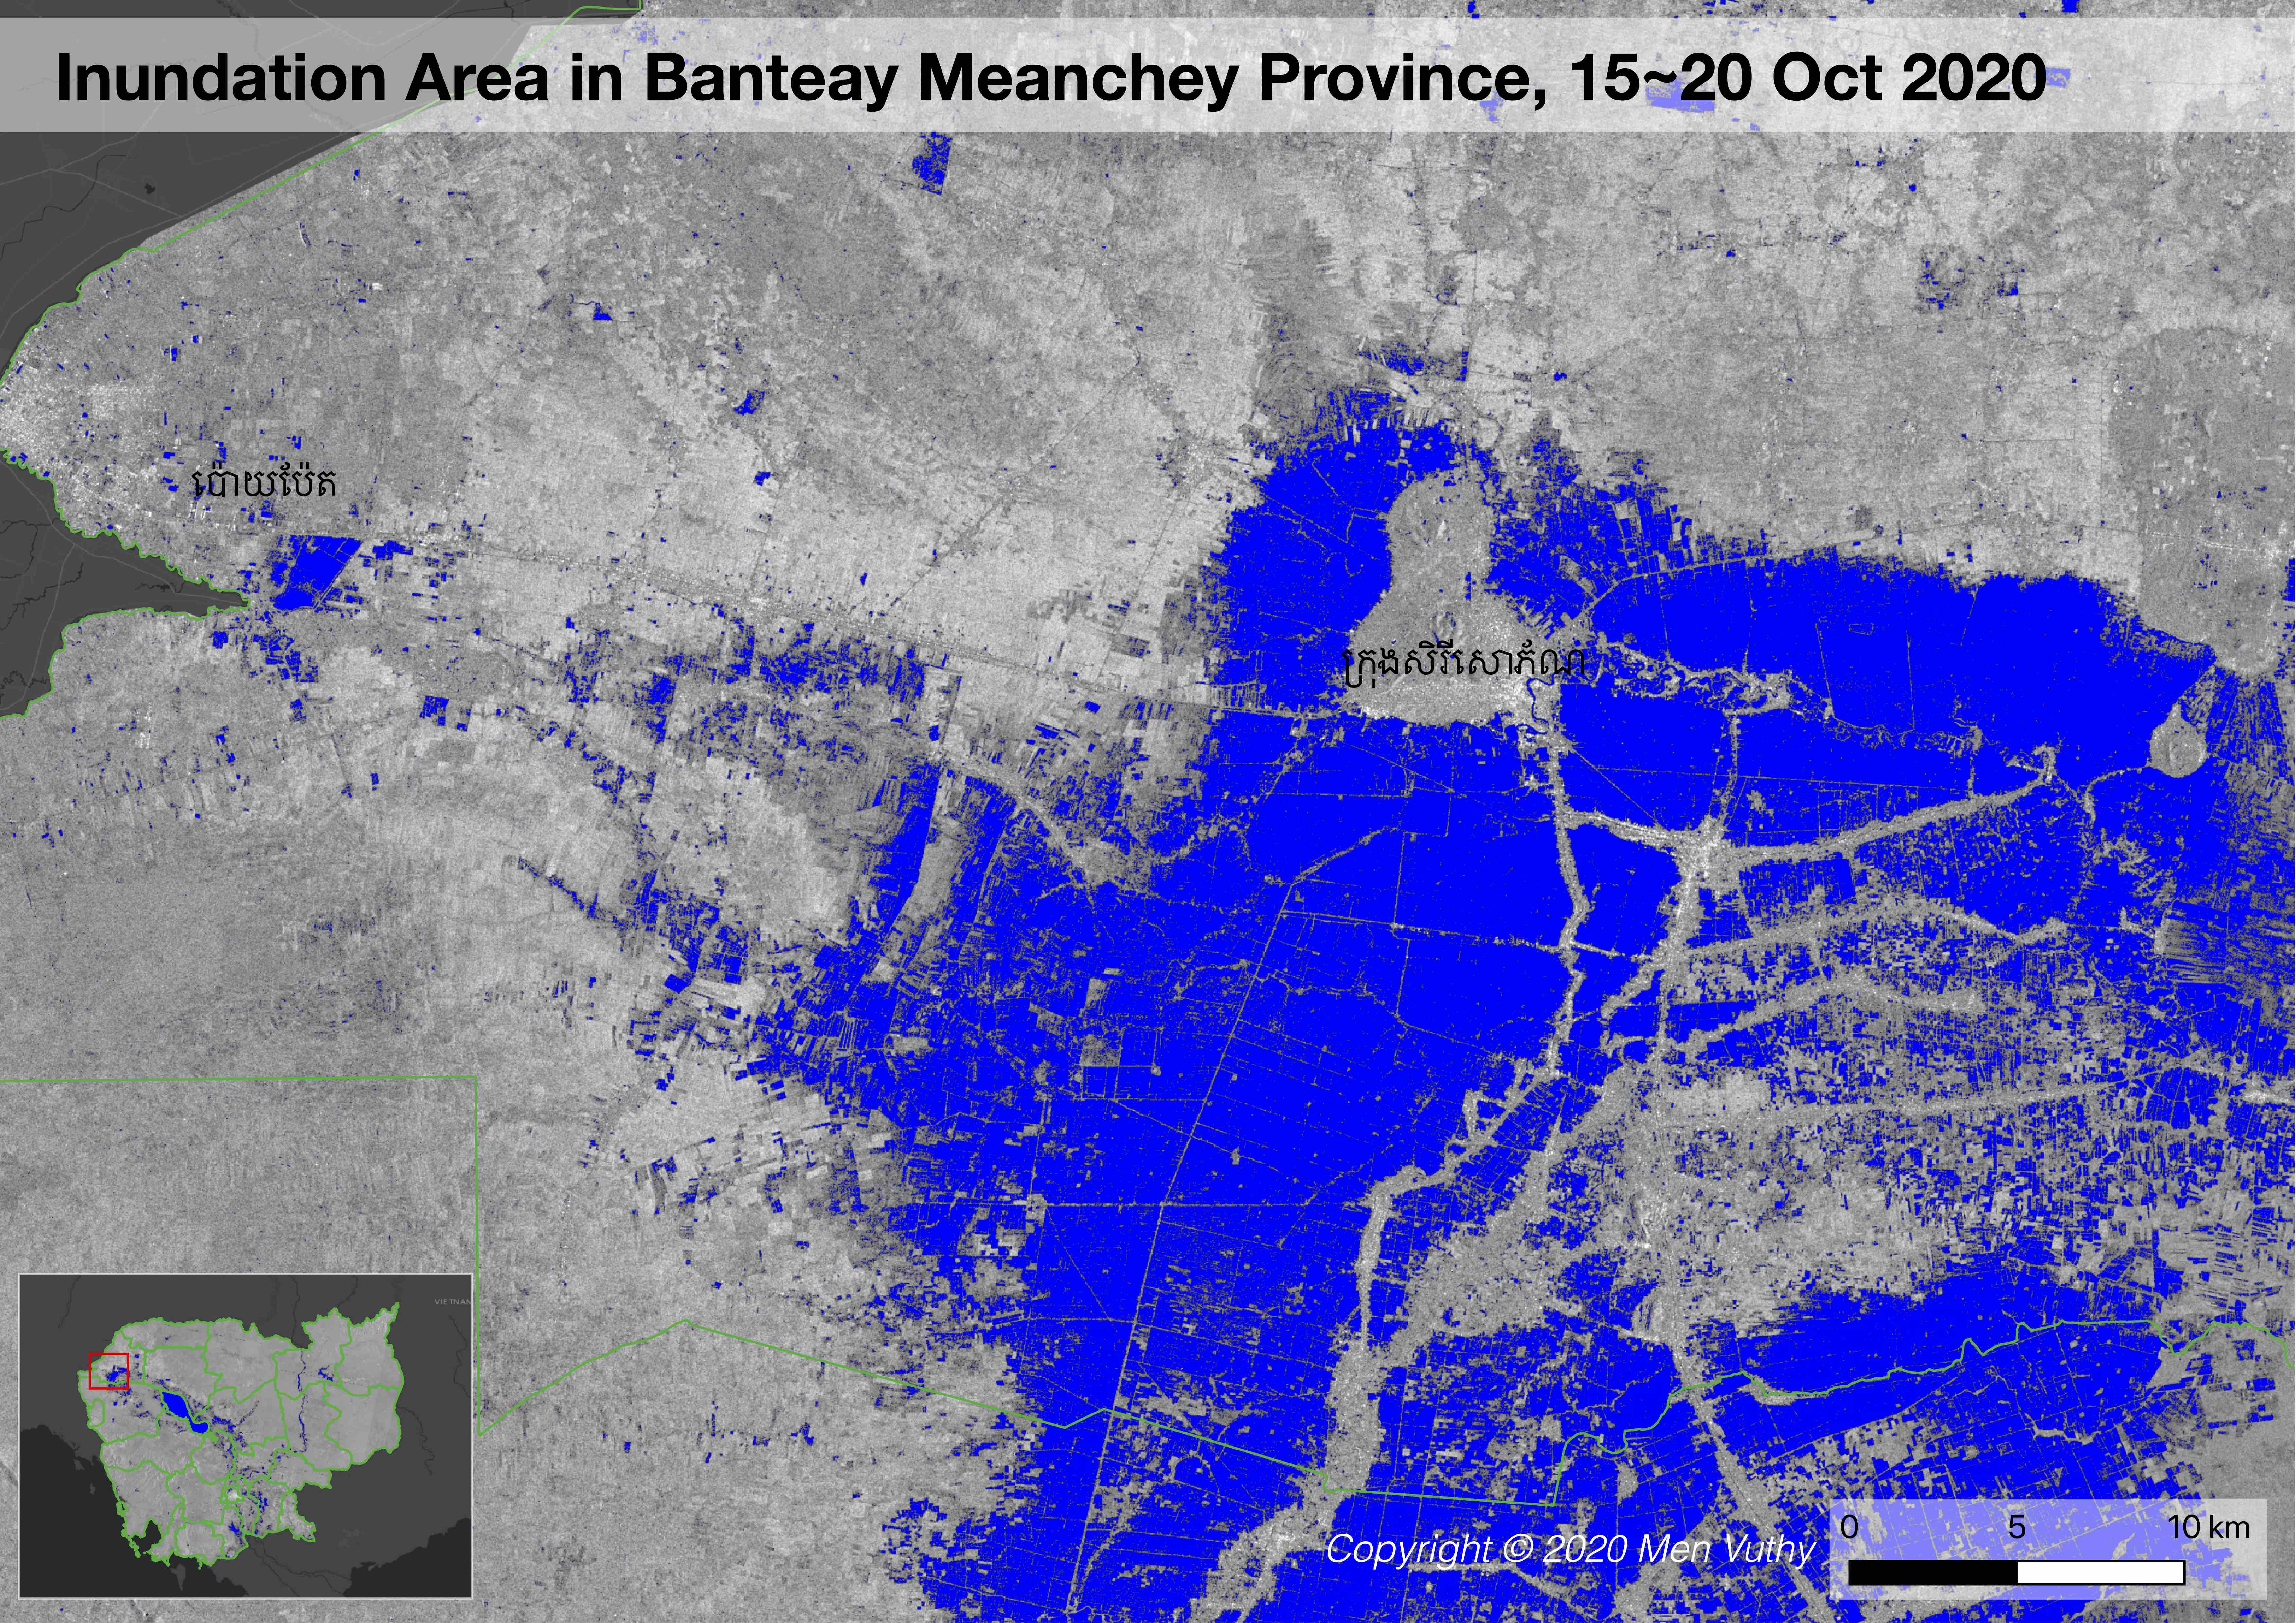
Banteay Meanchey
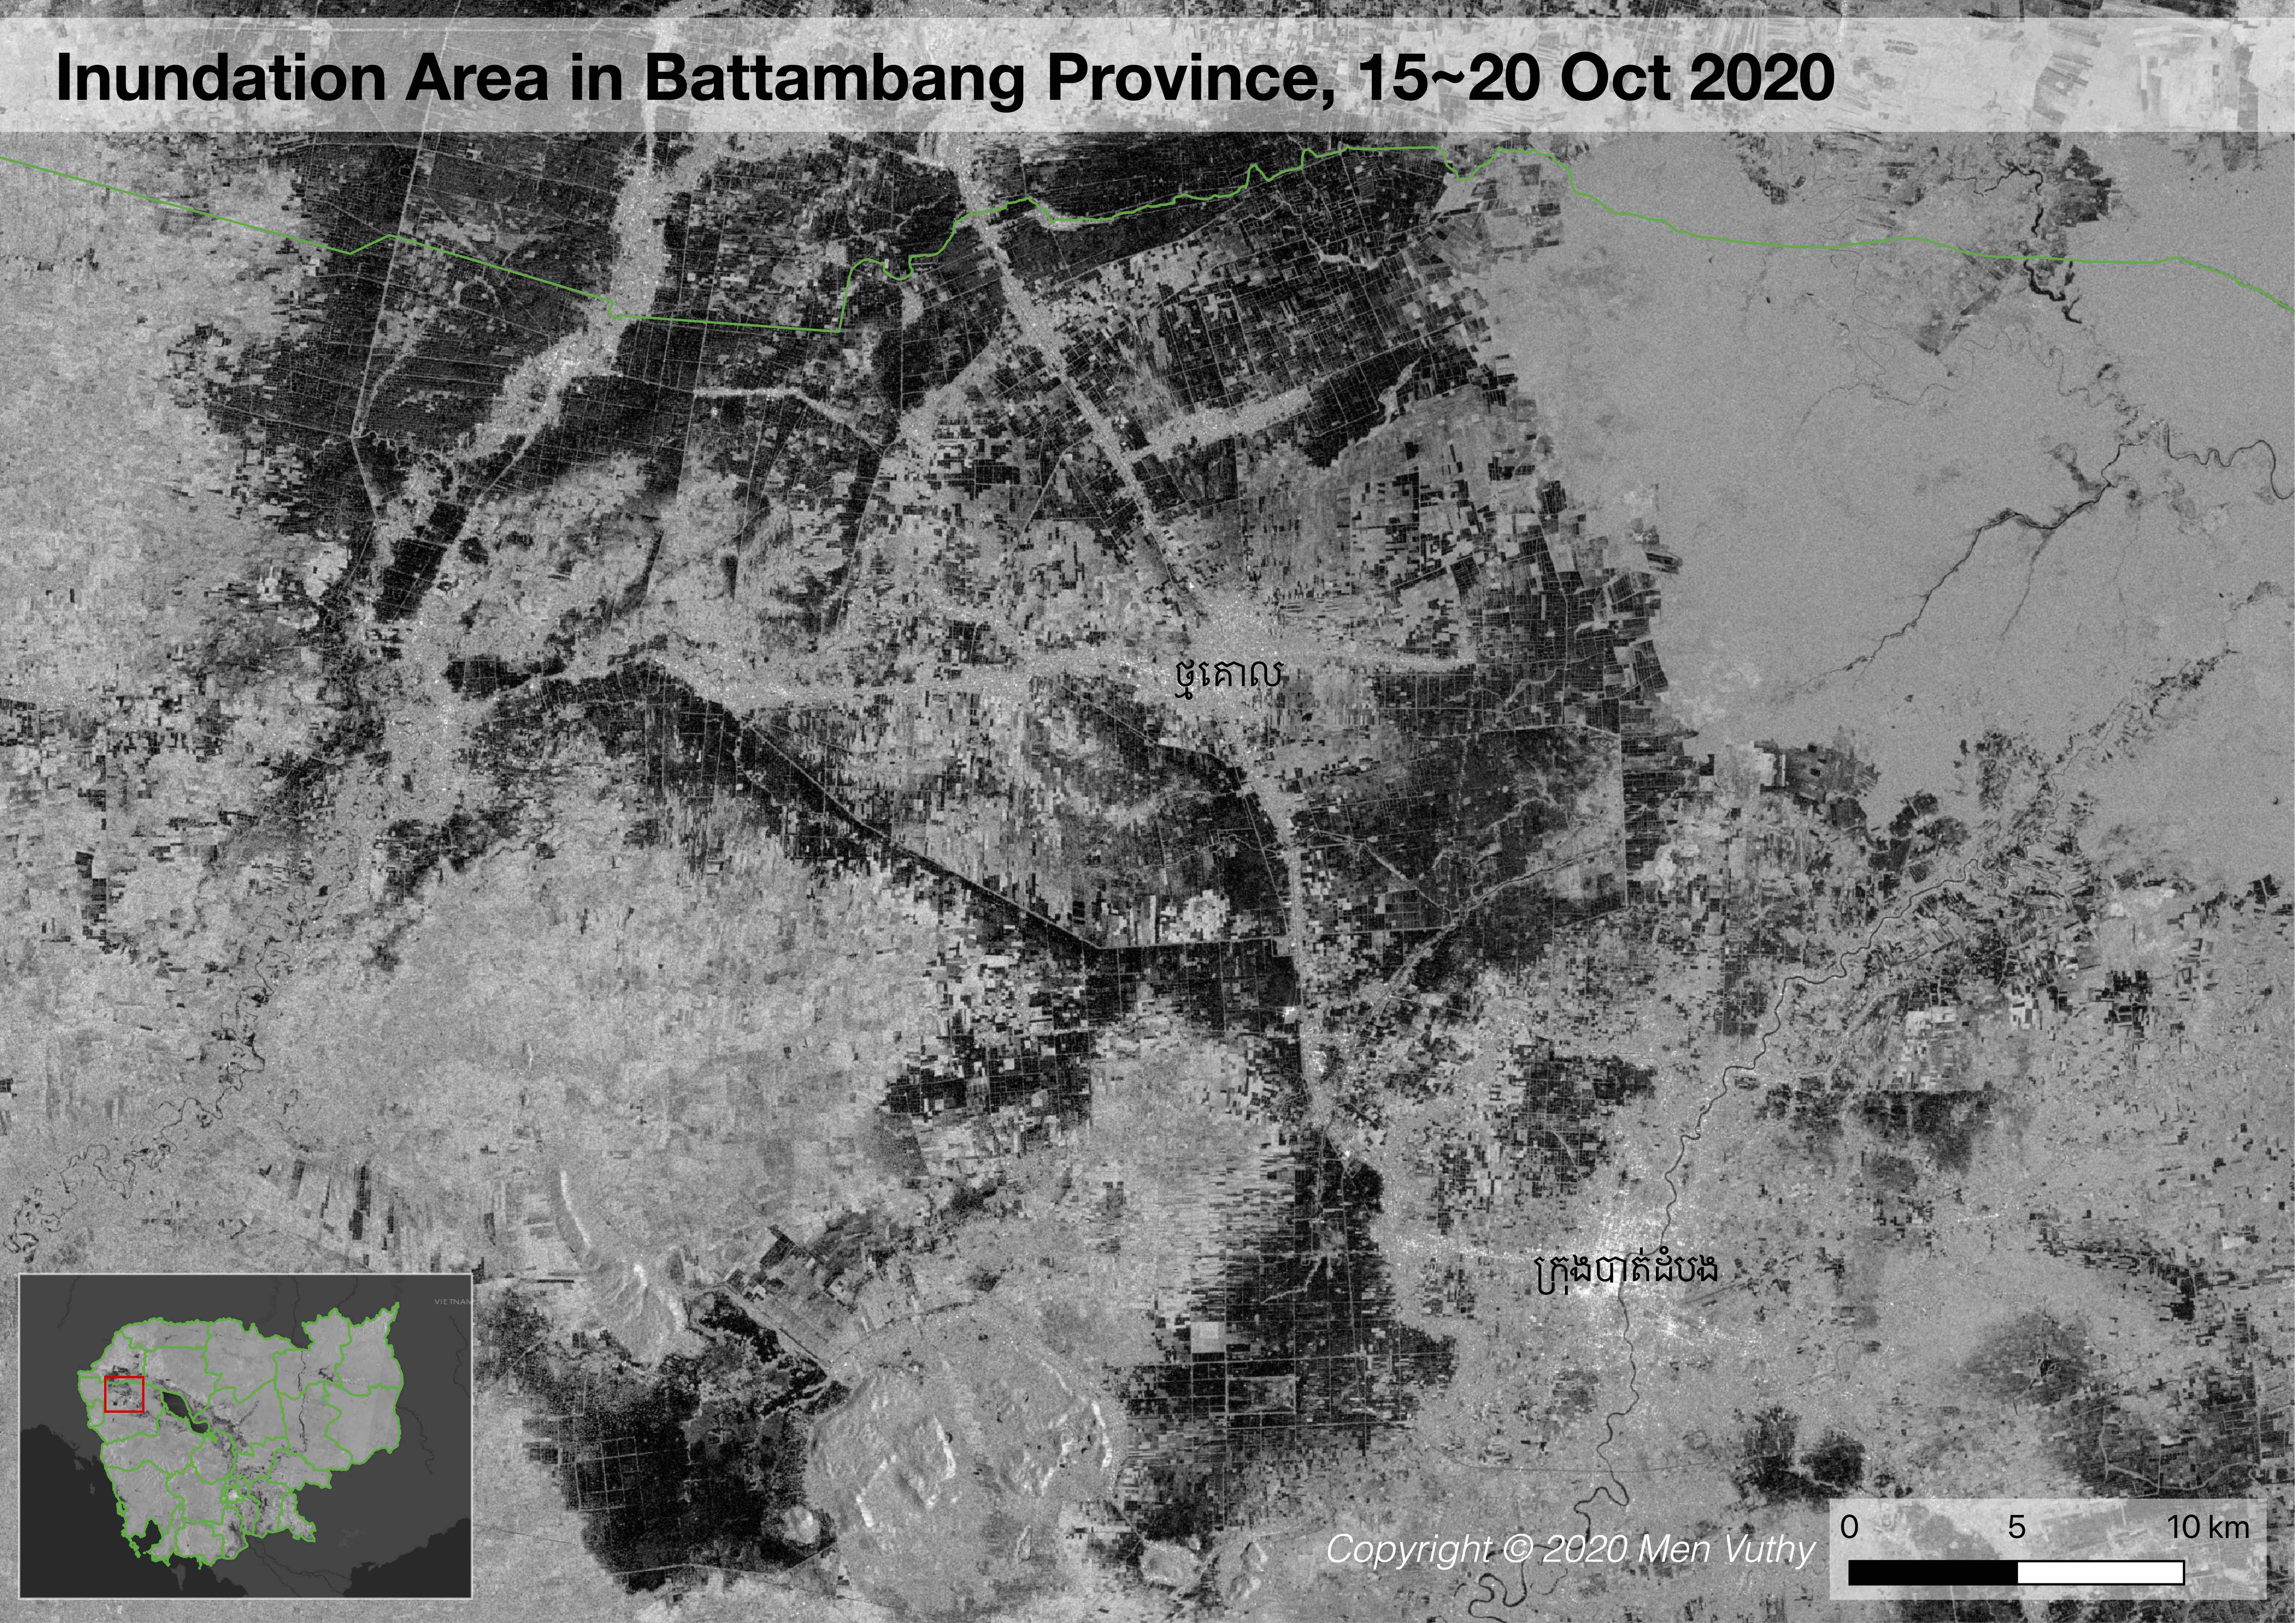
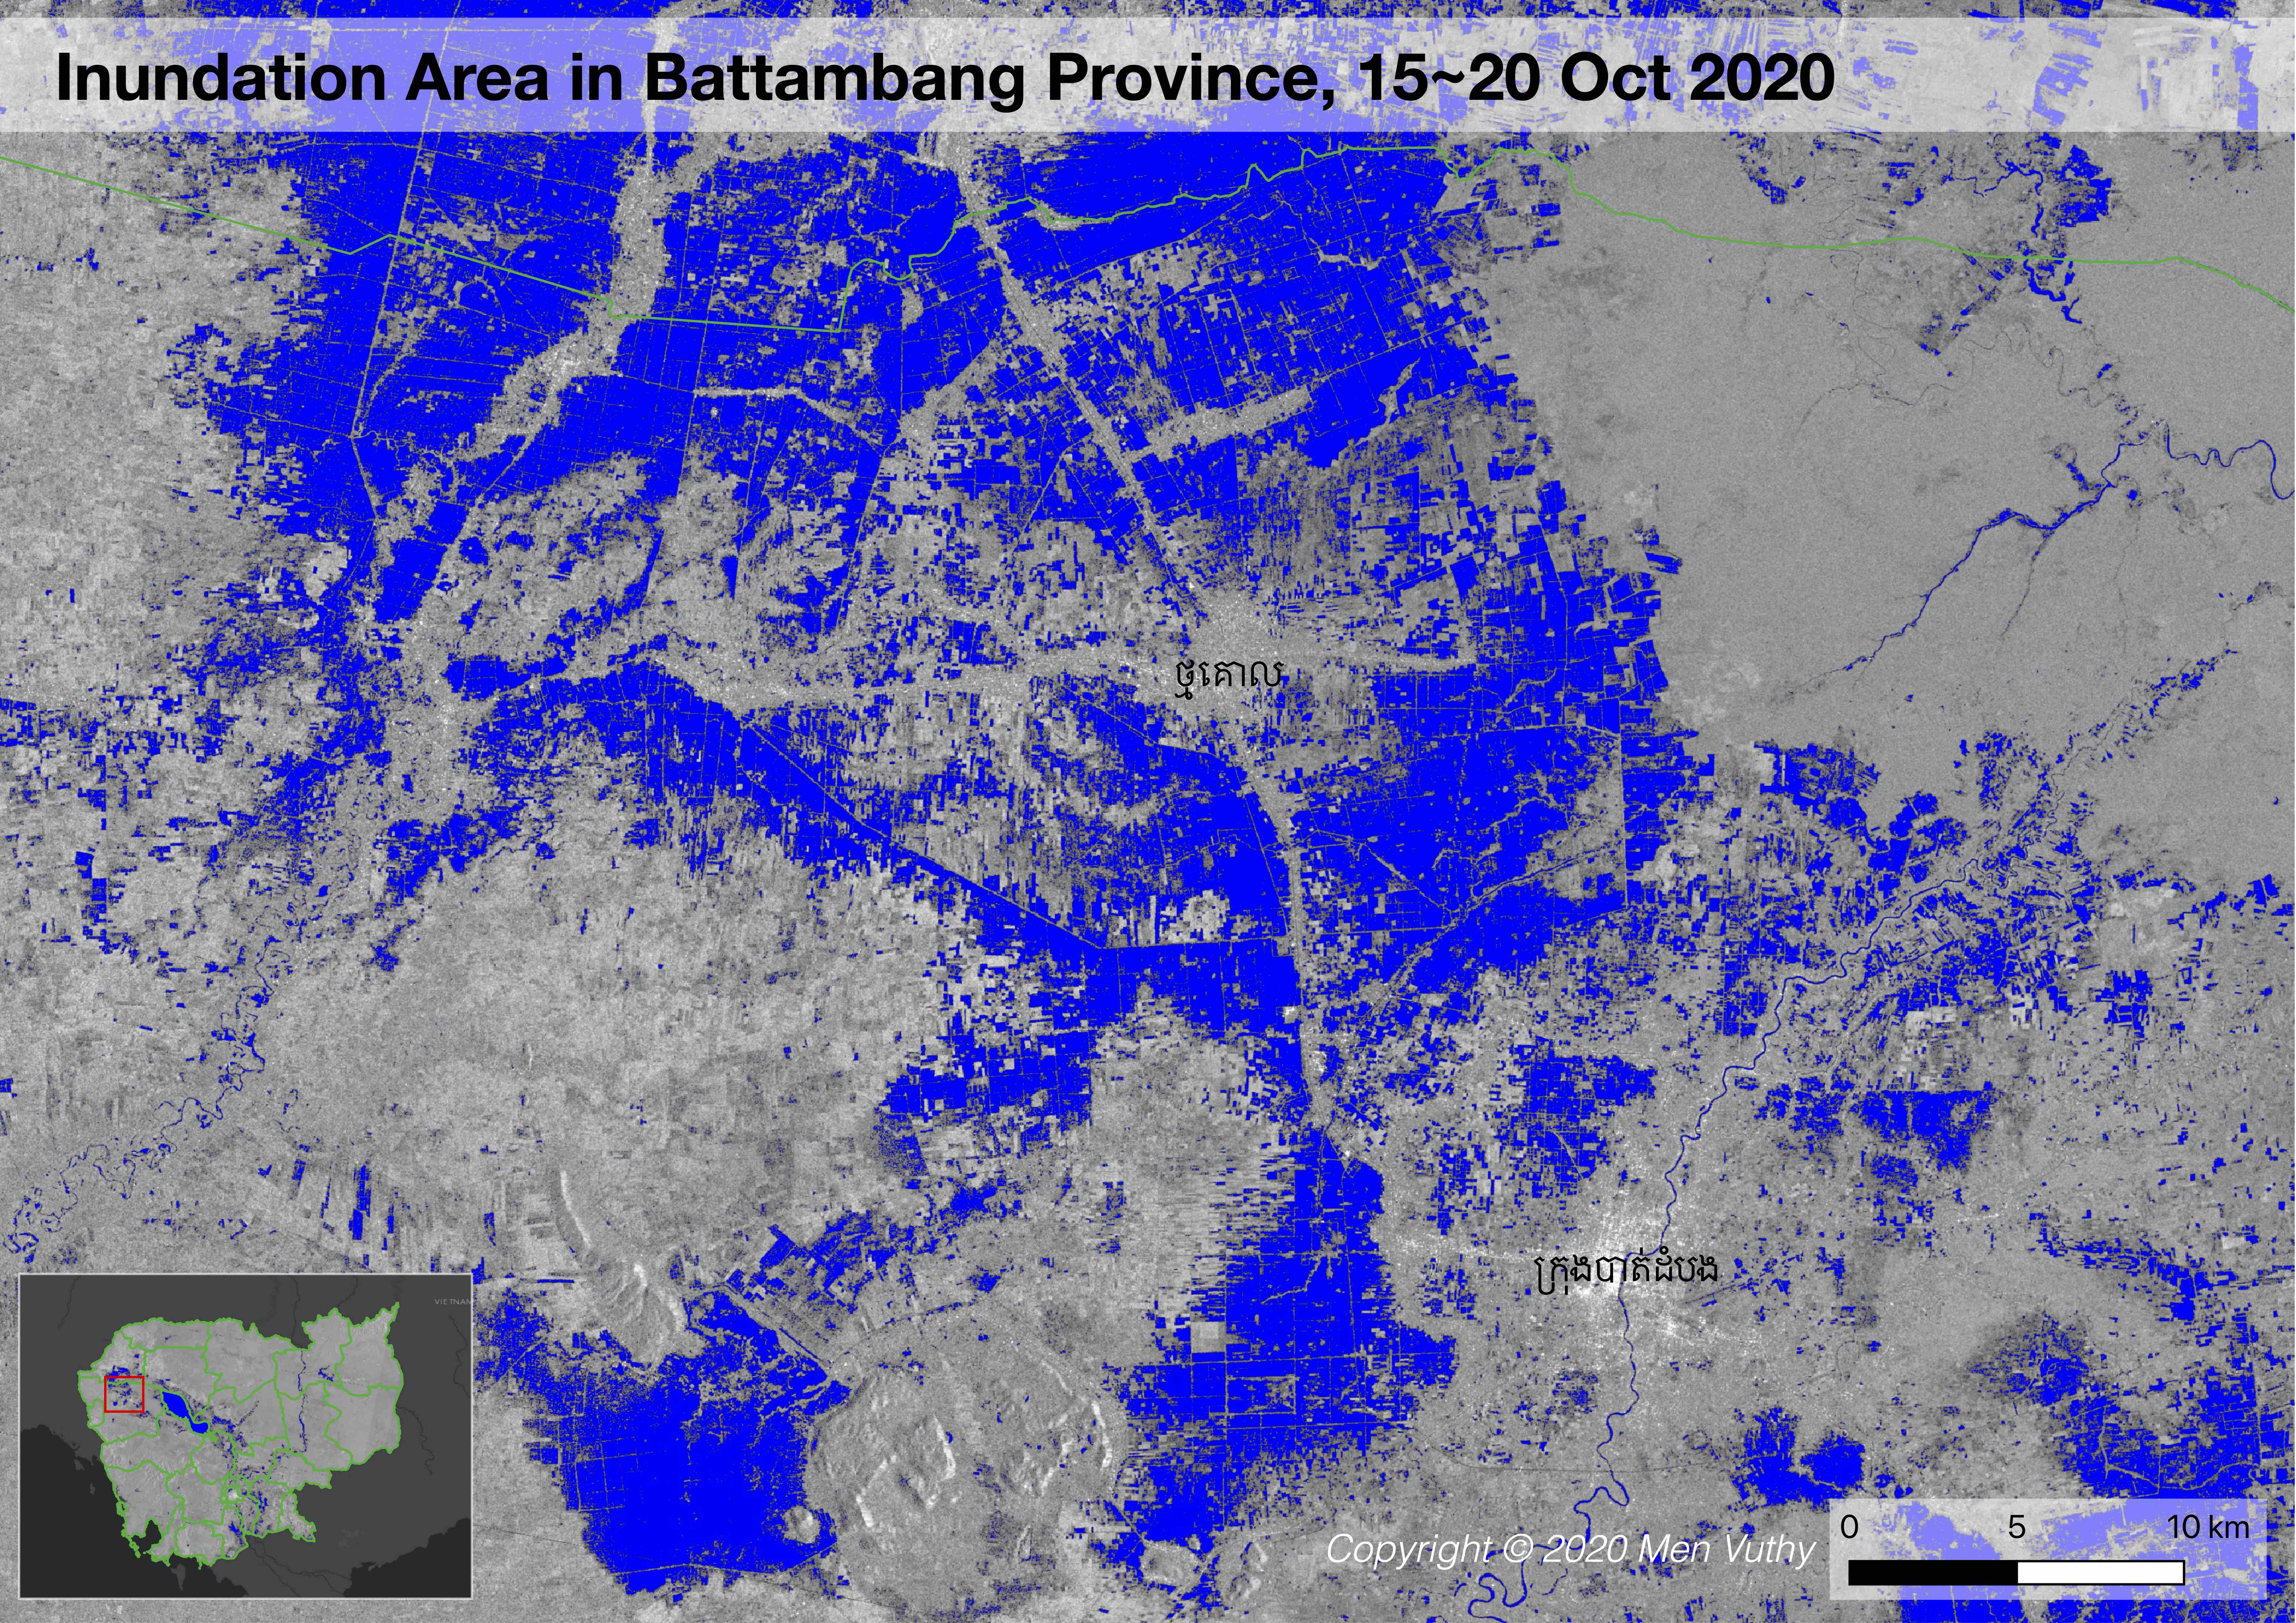
Battambang
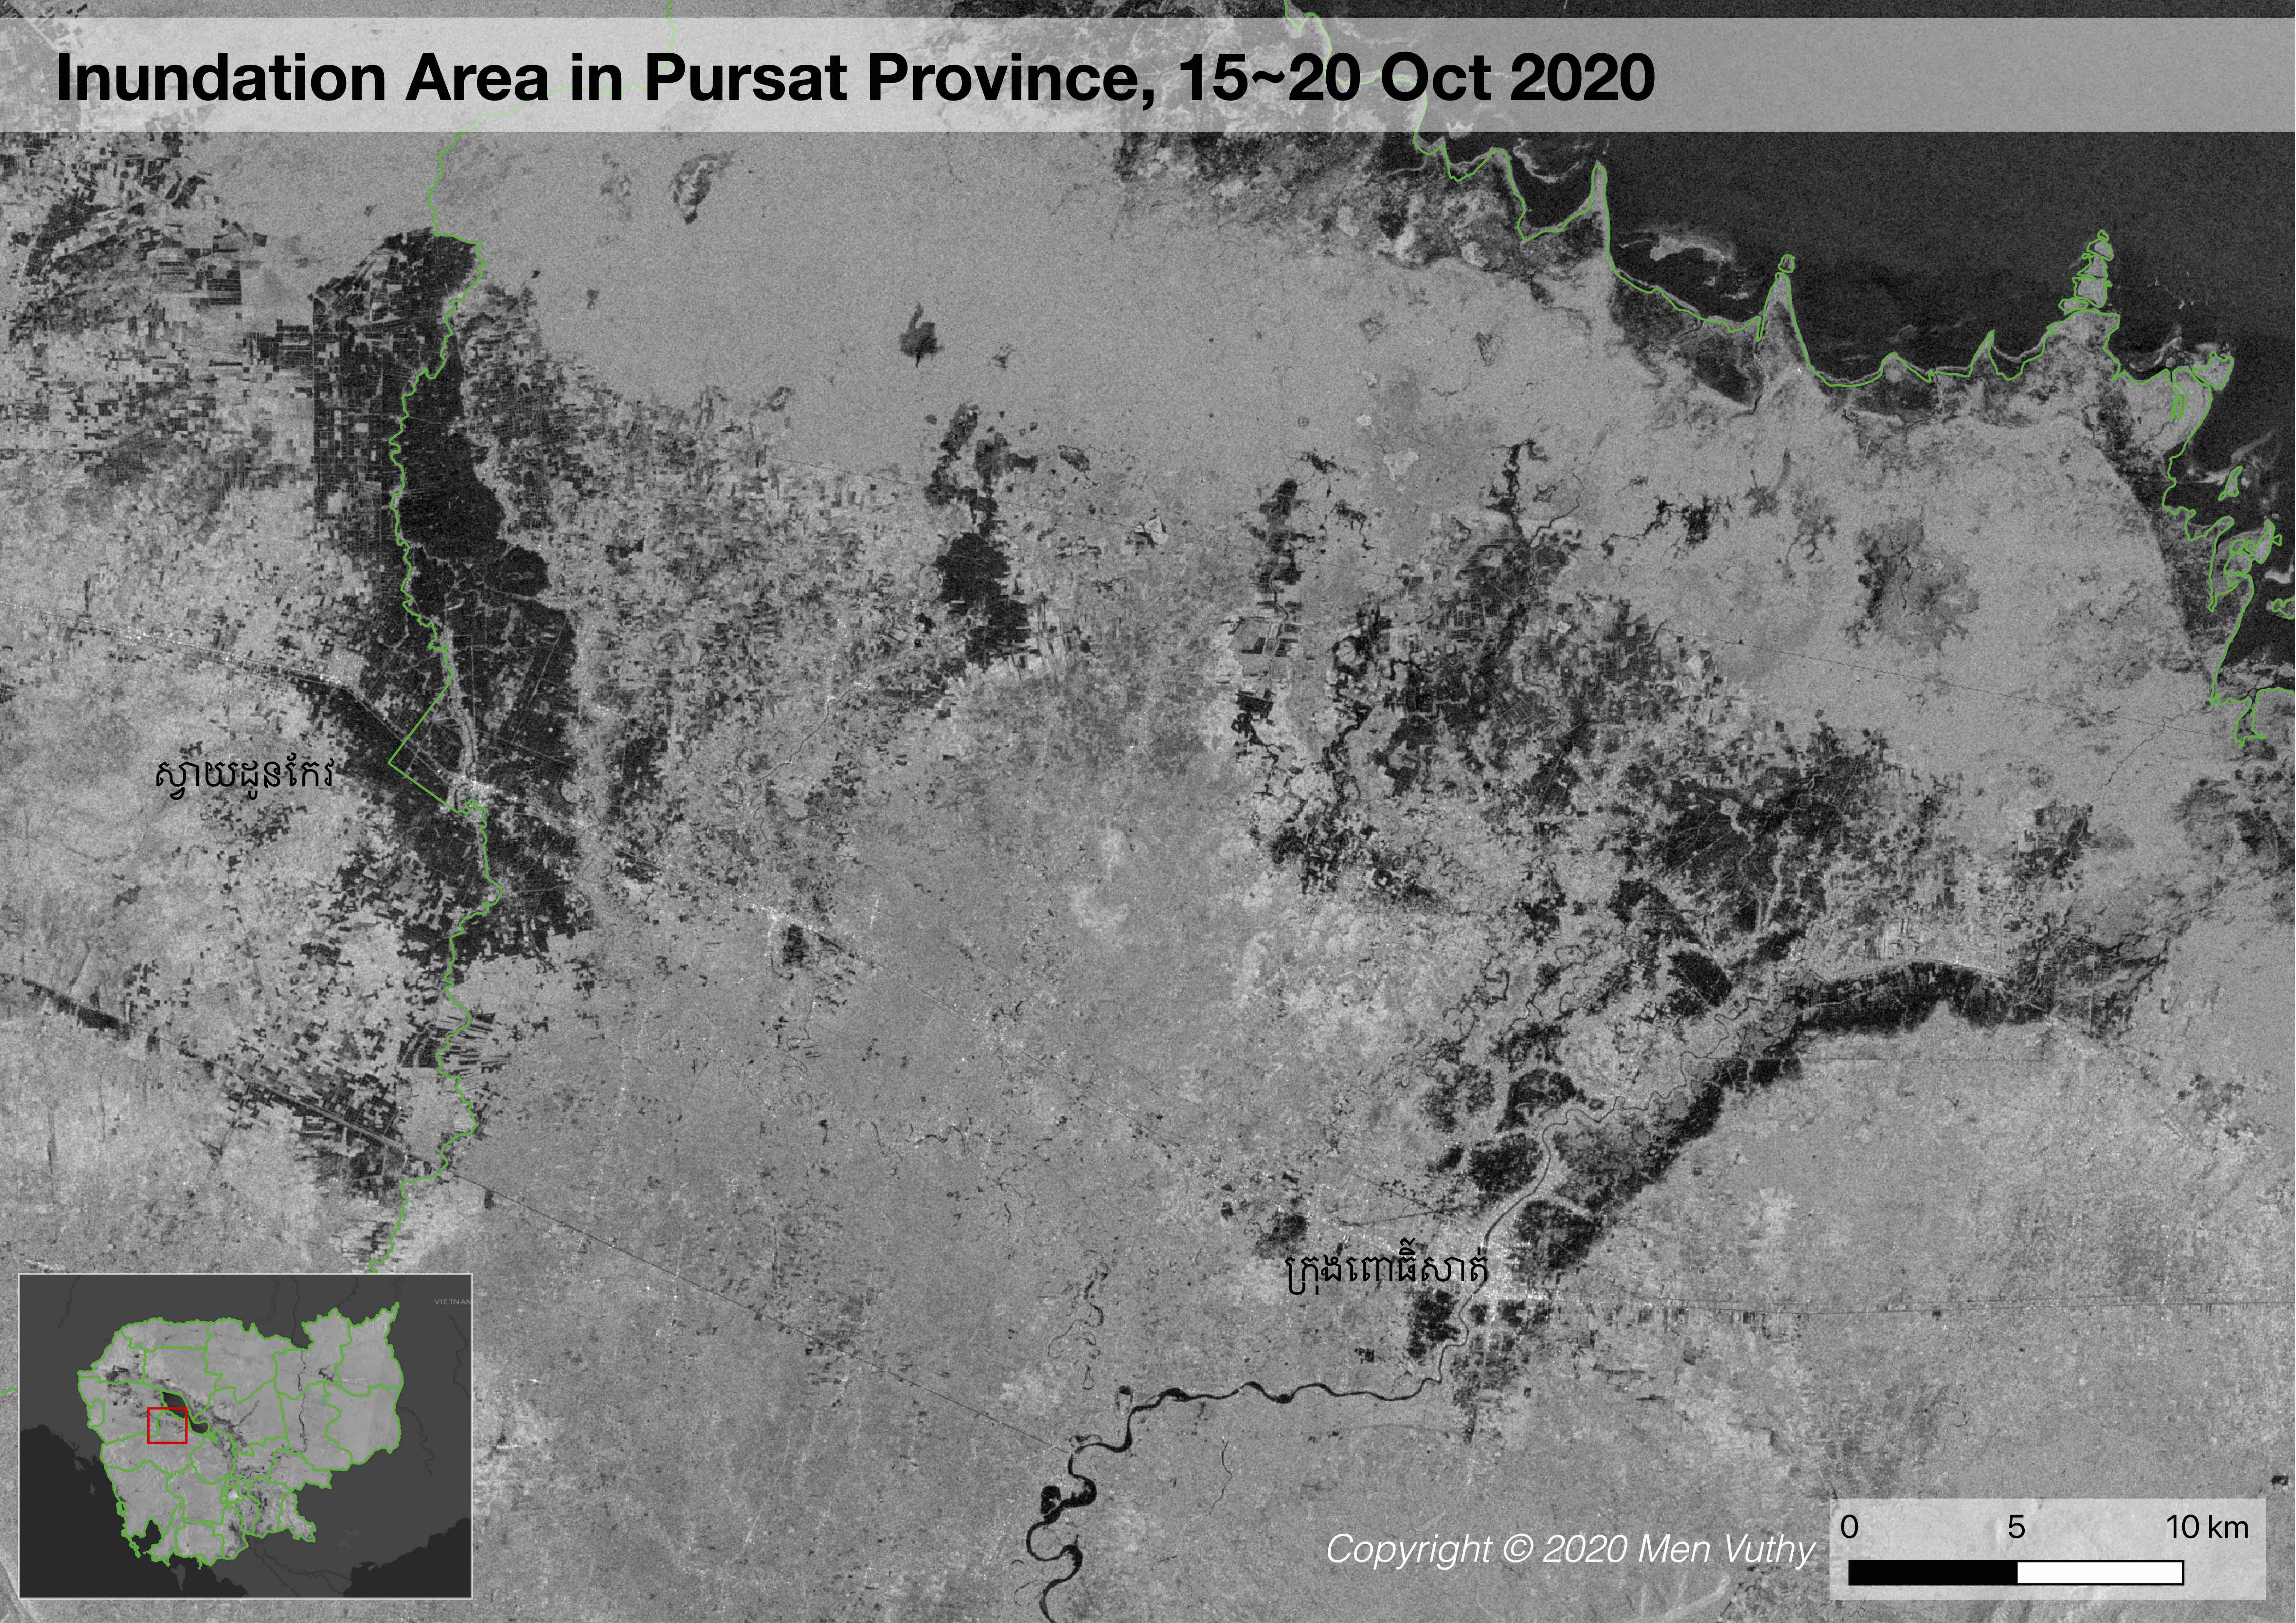
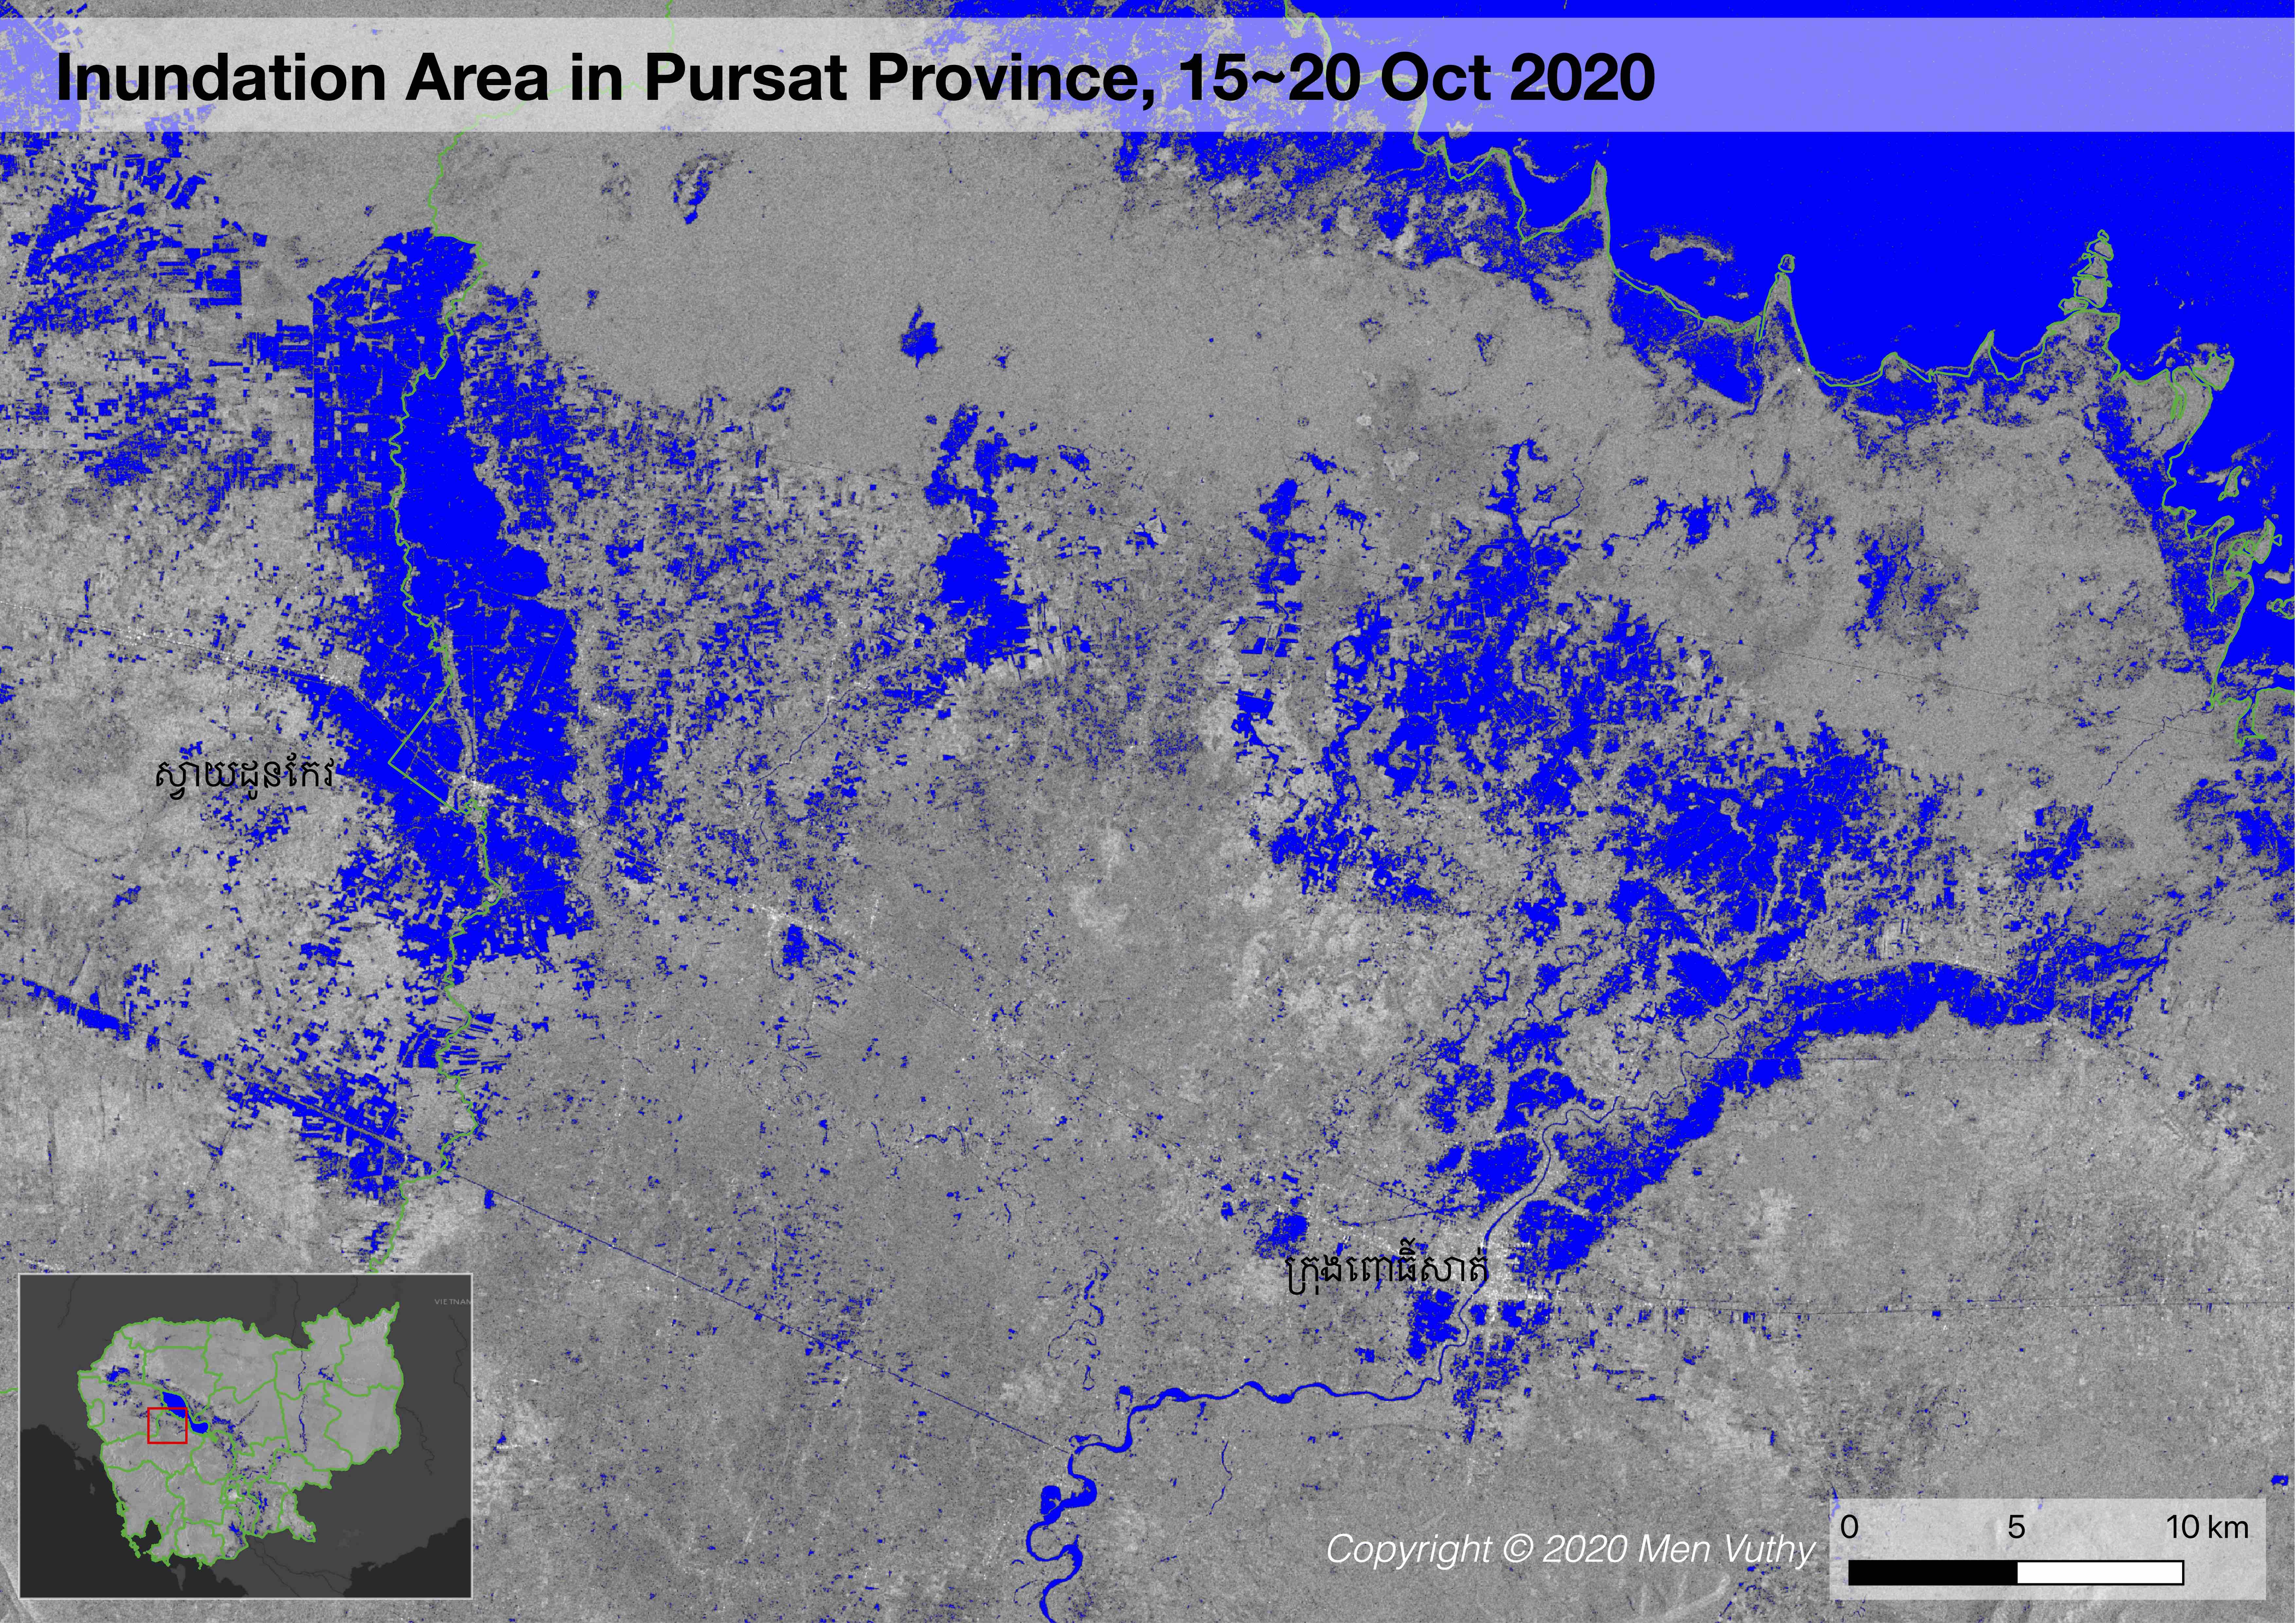
Pursat
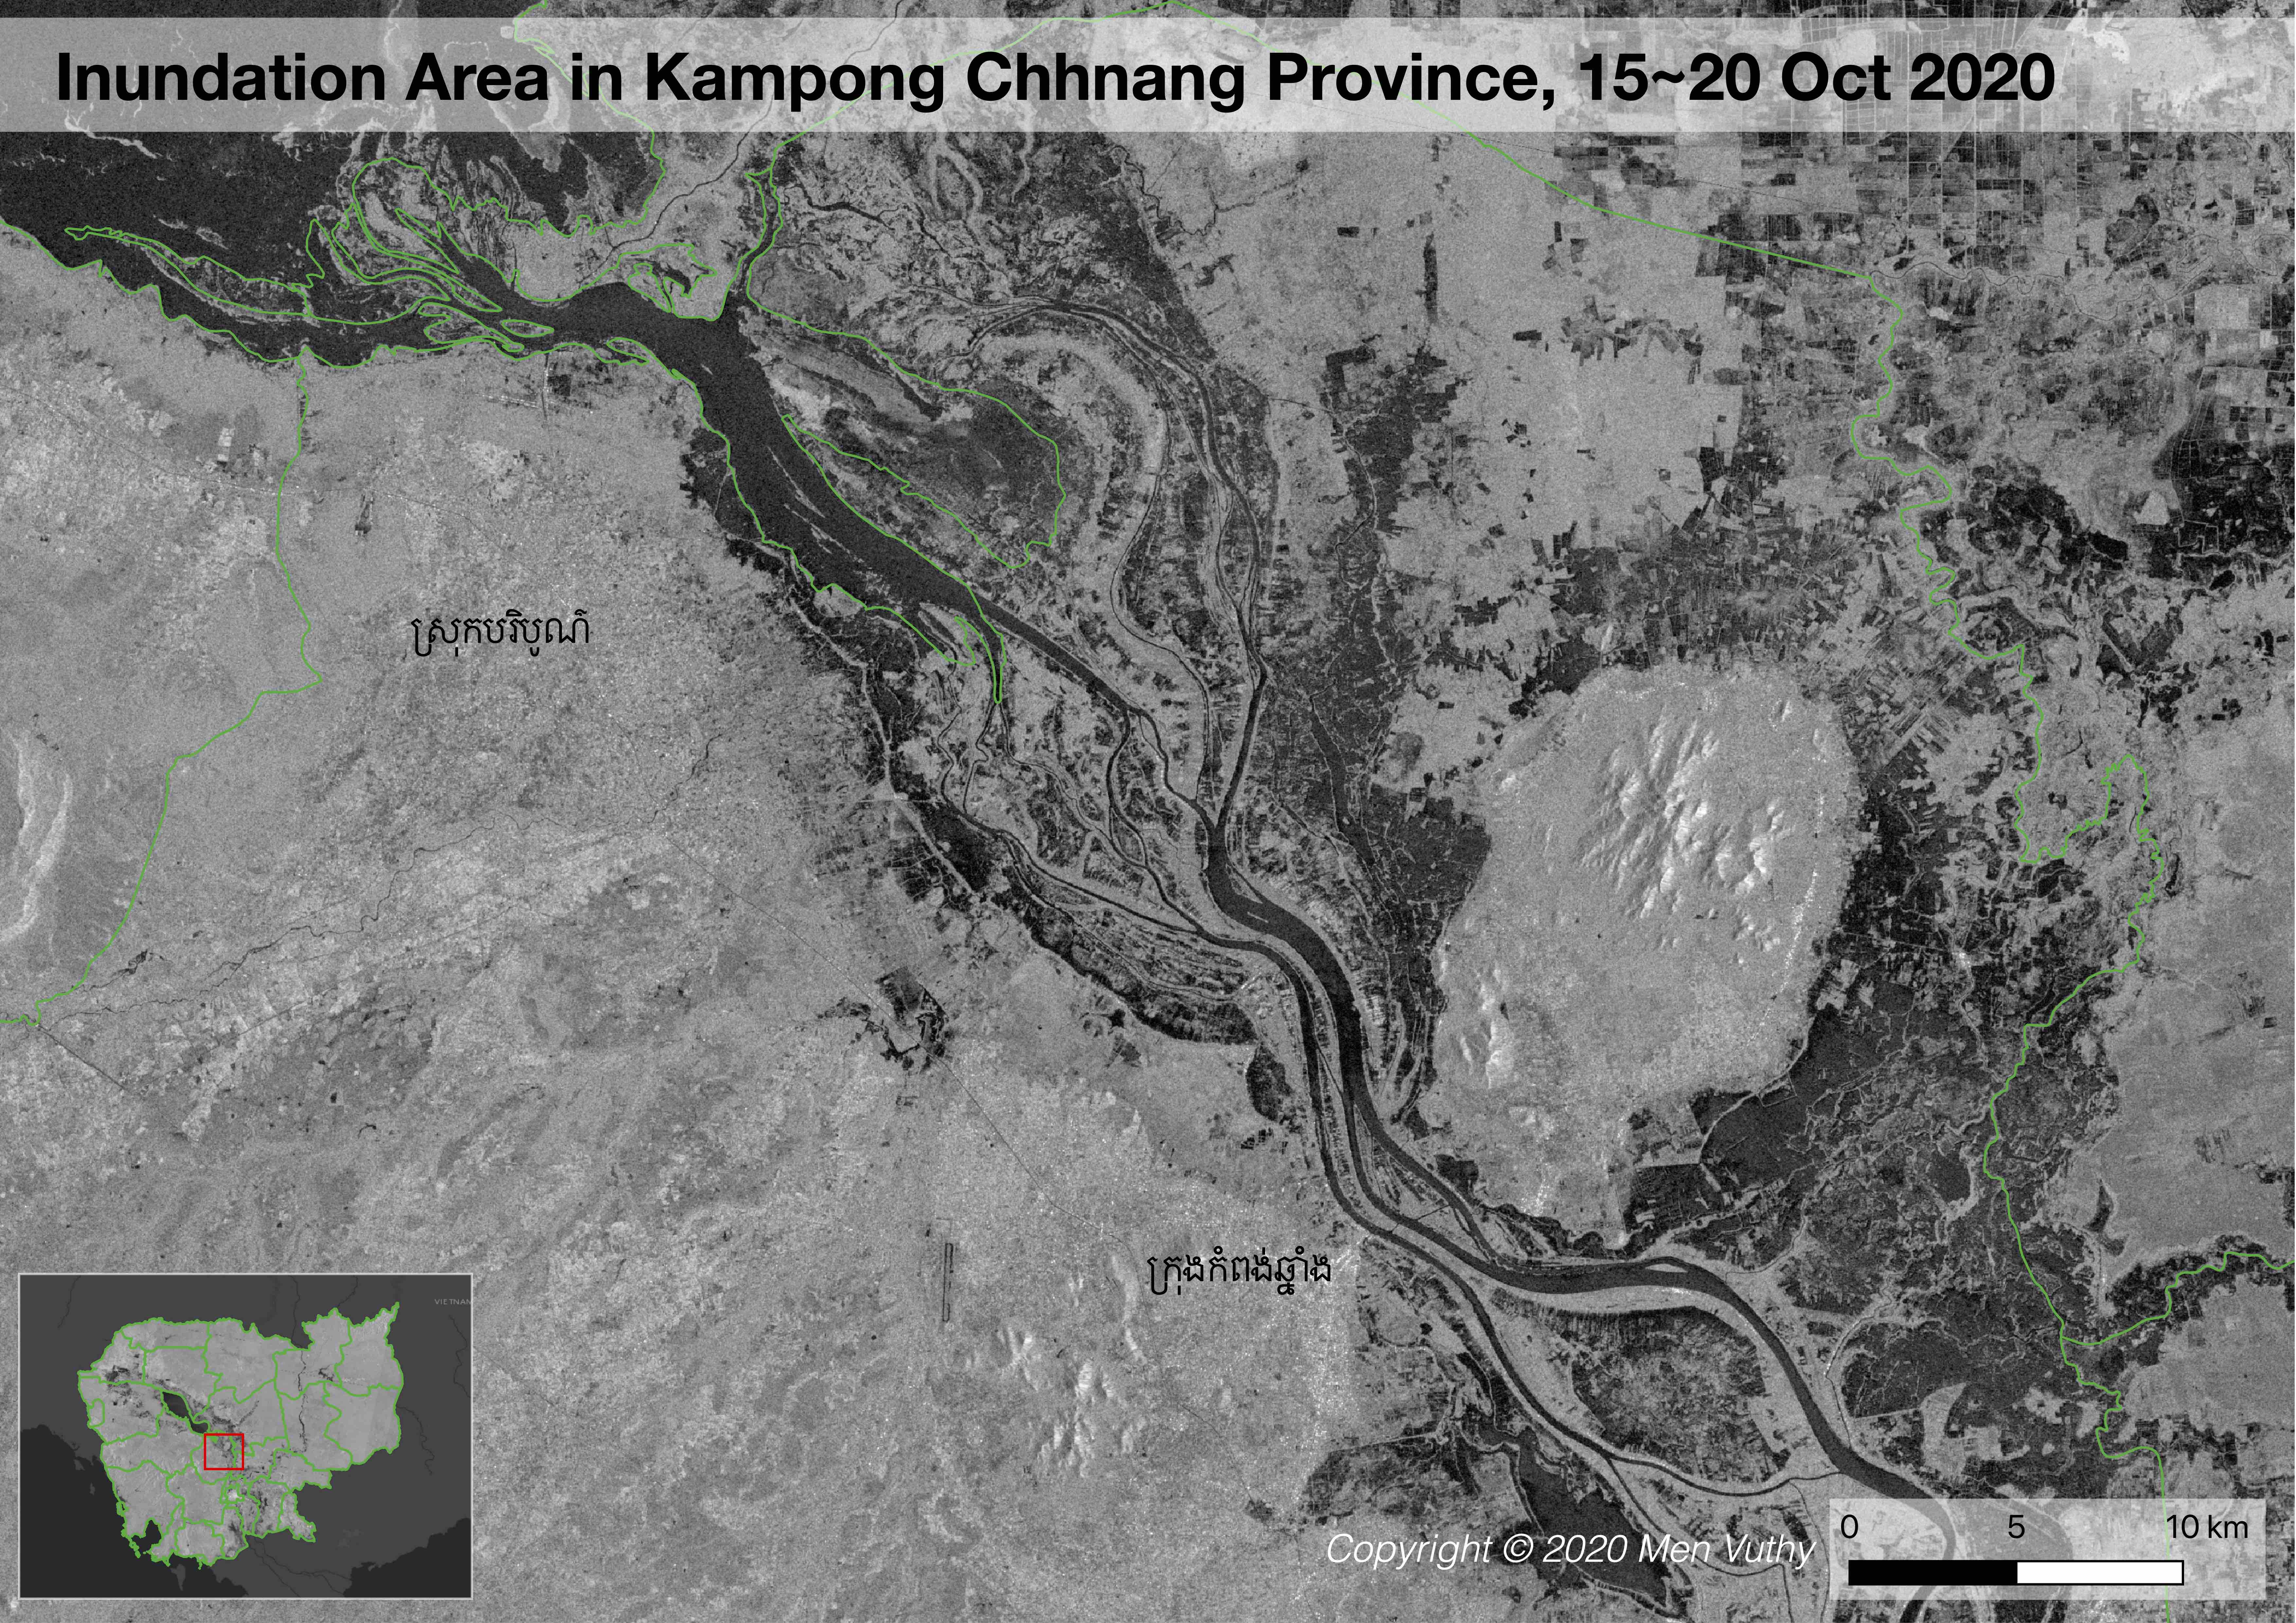
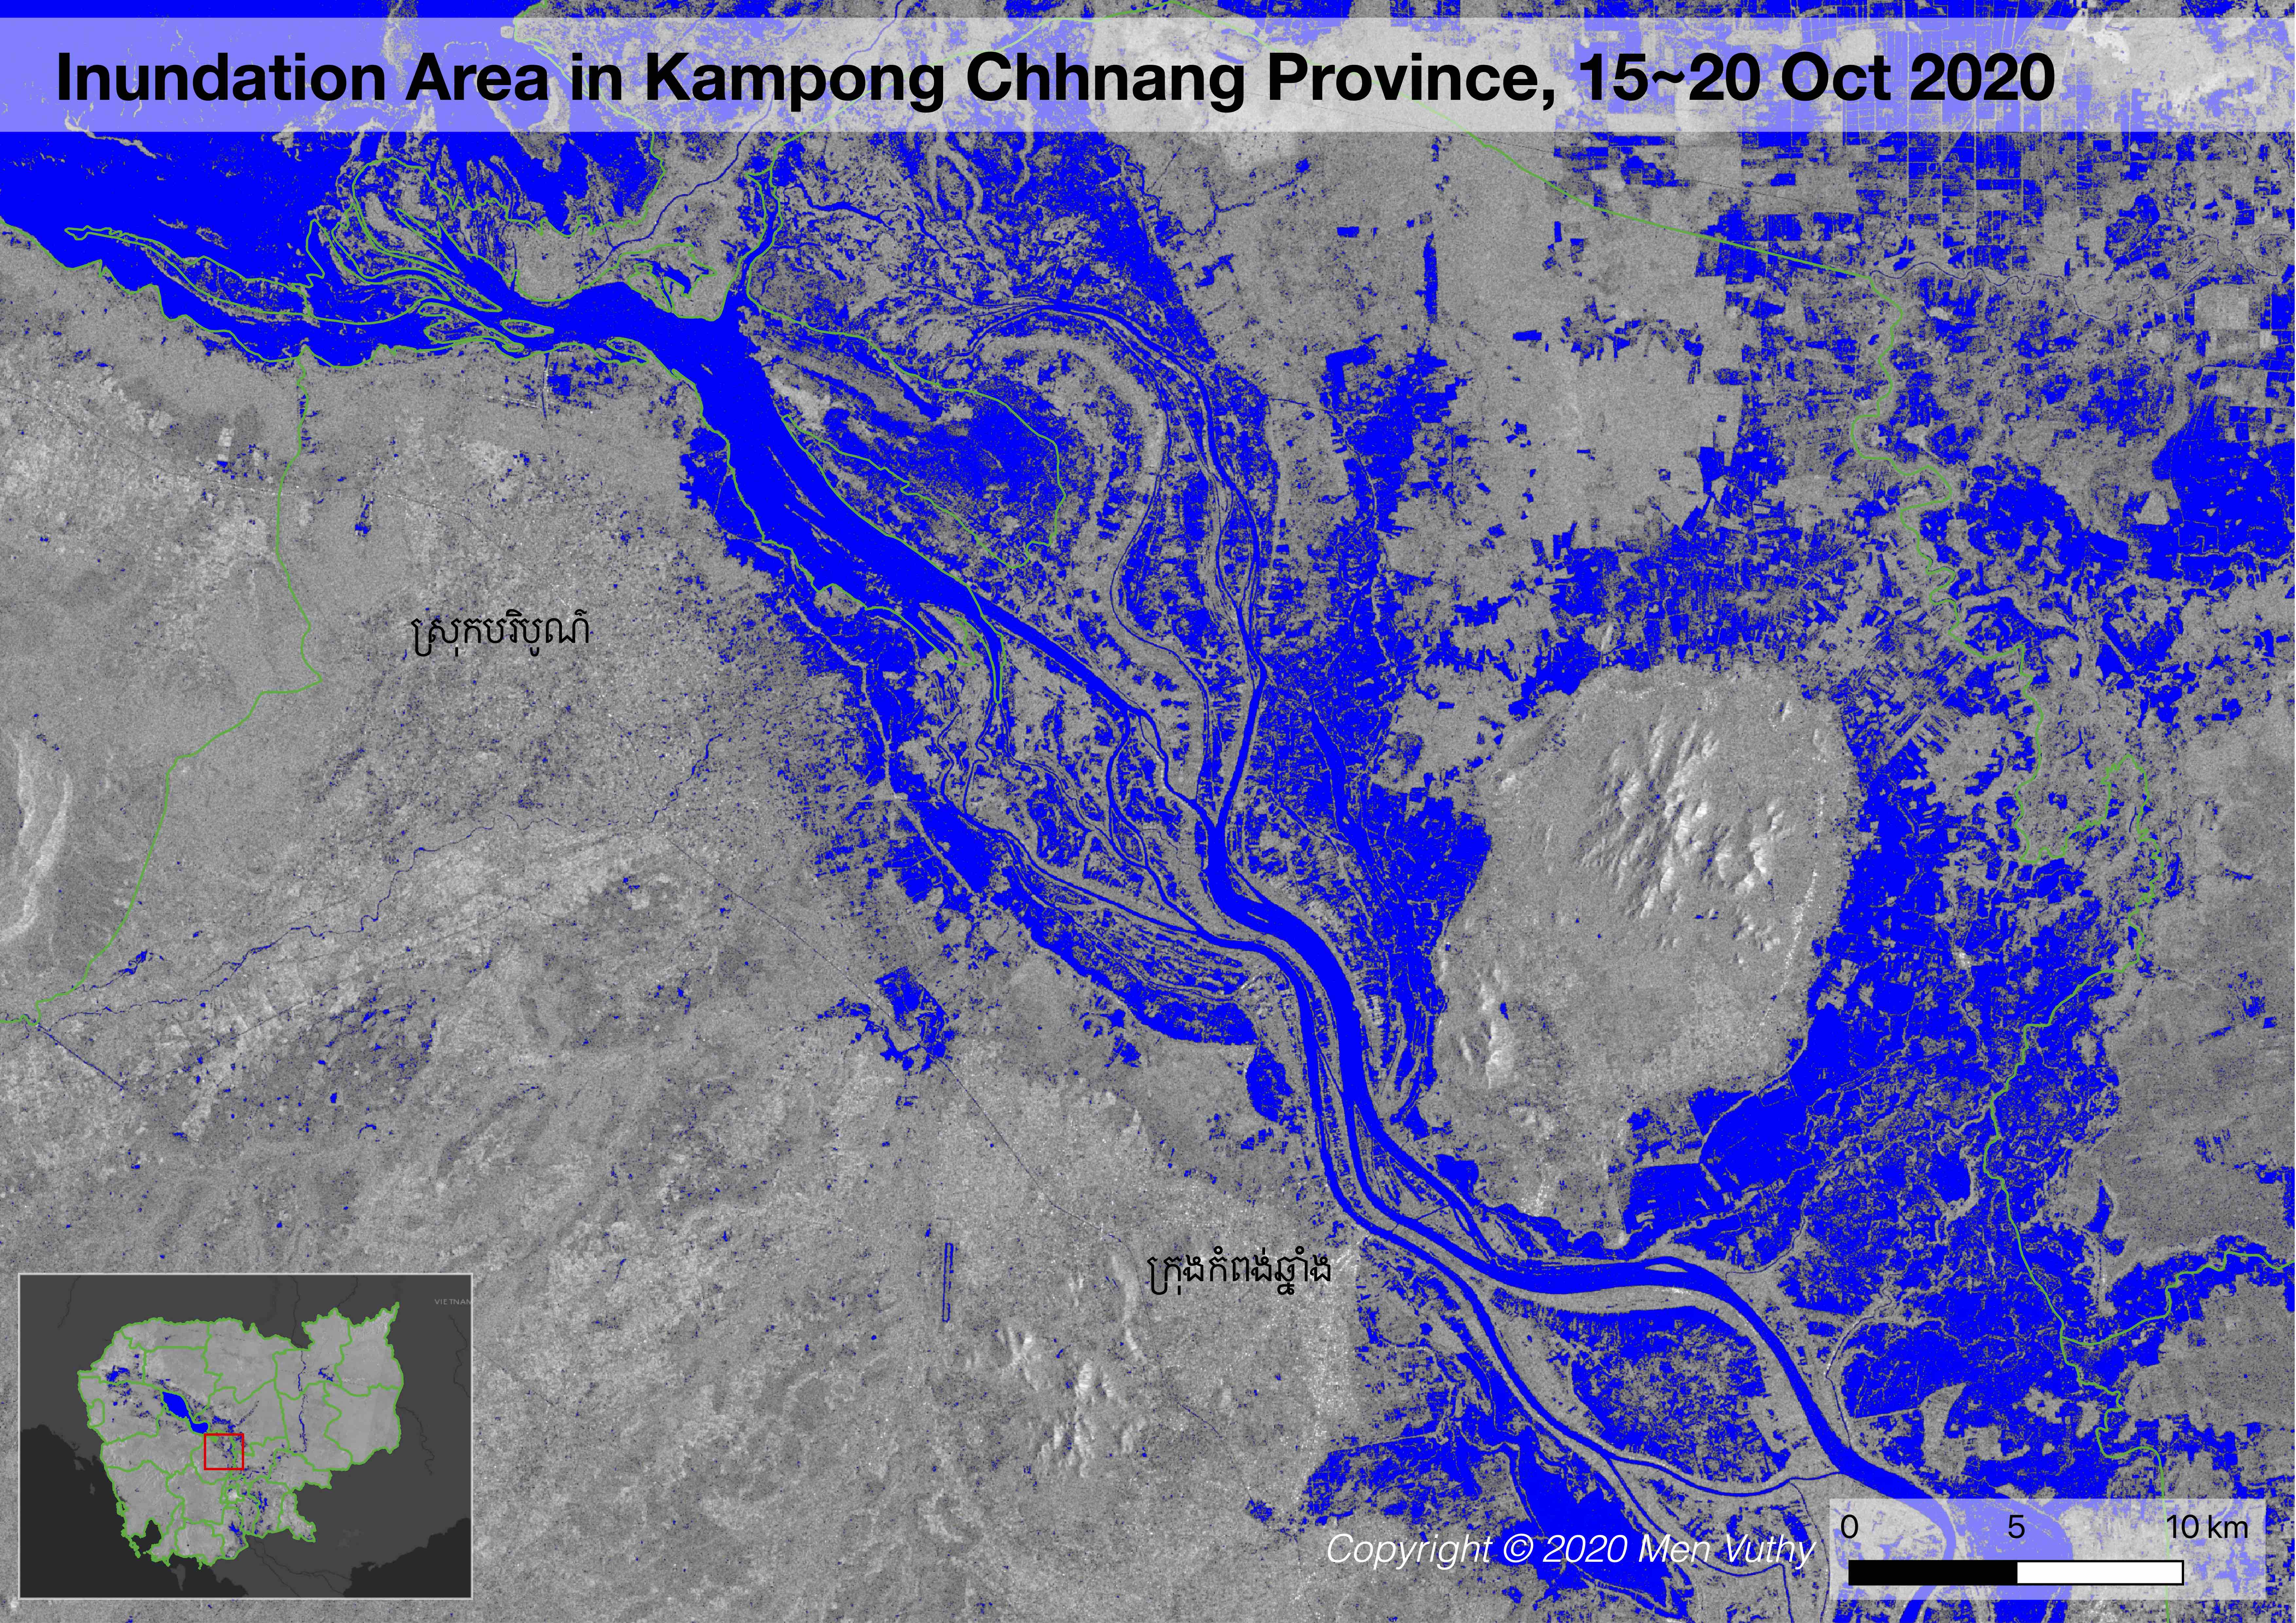
Kampong Chhnang
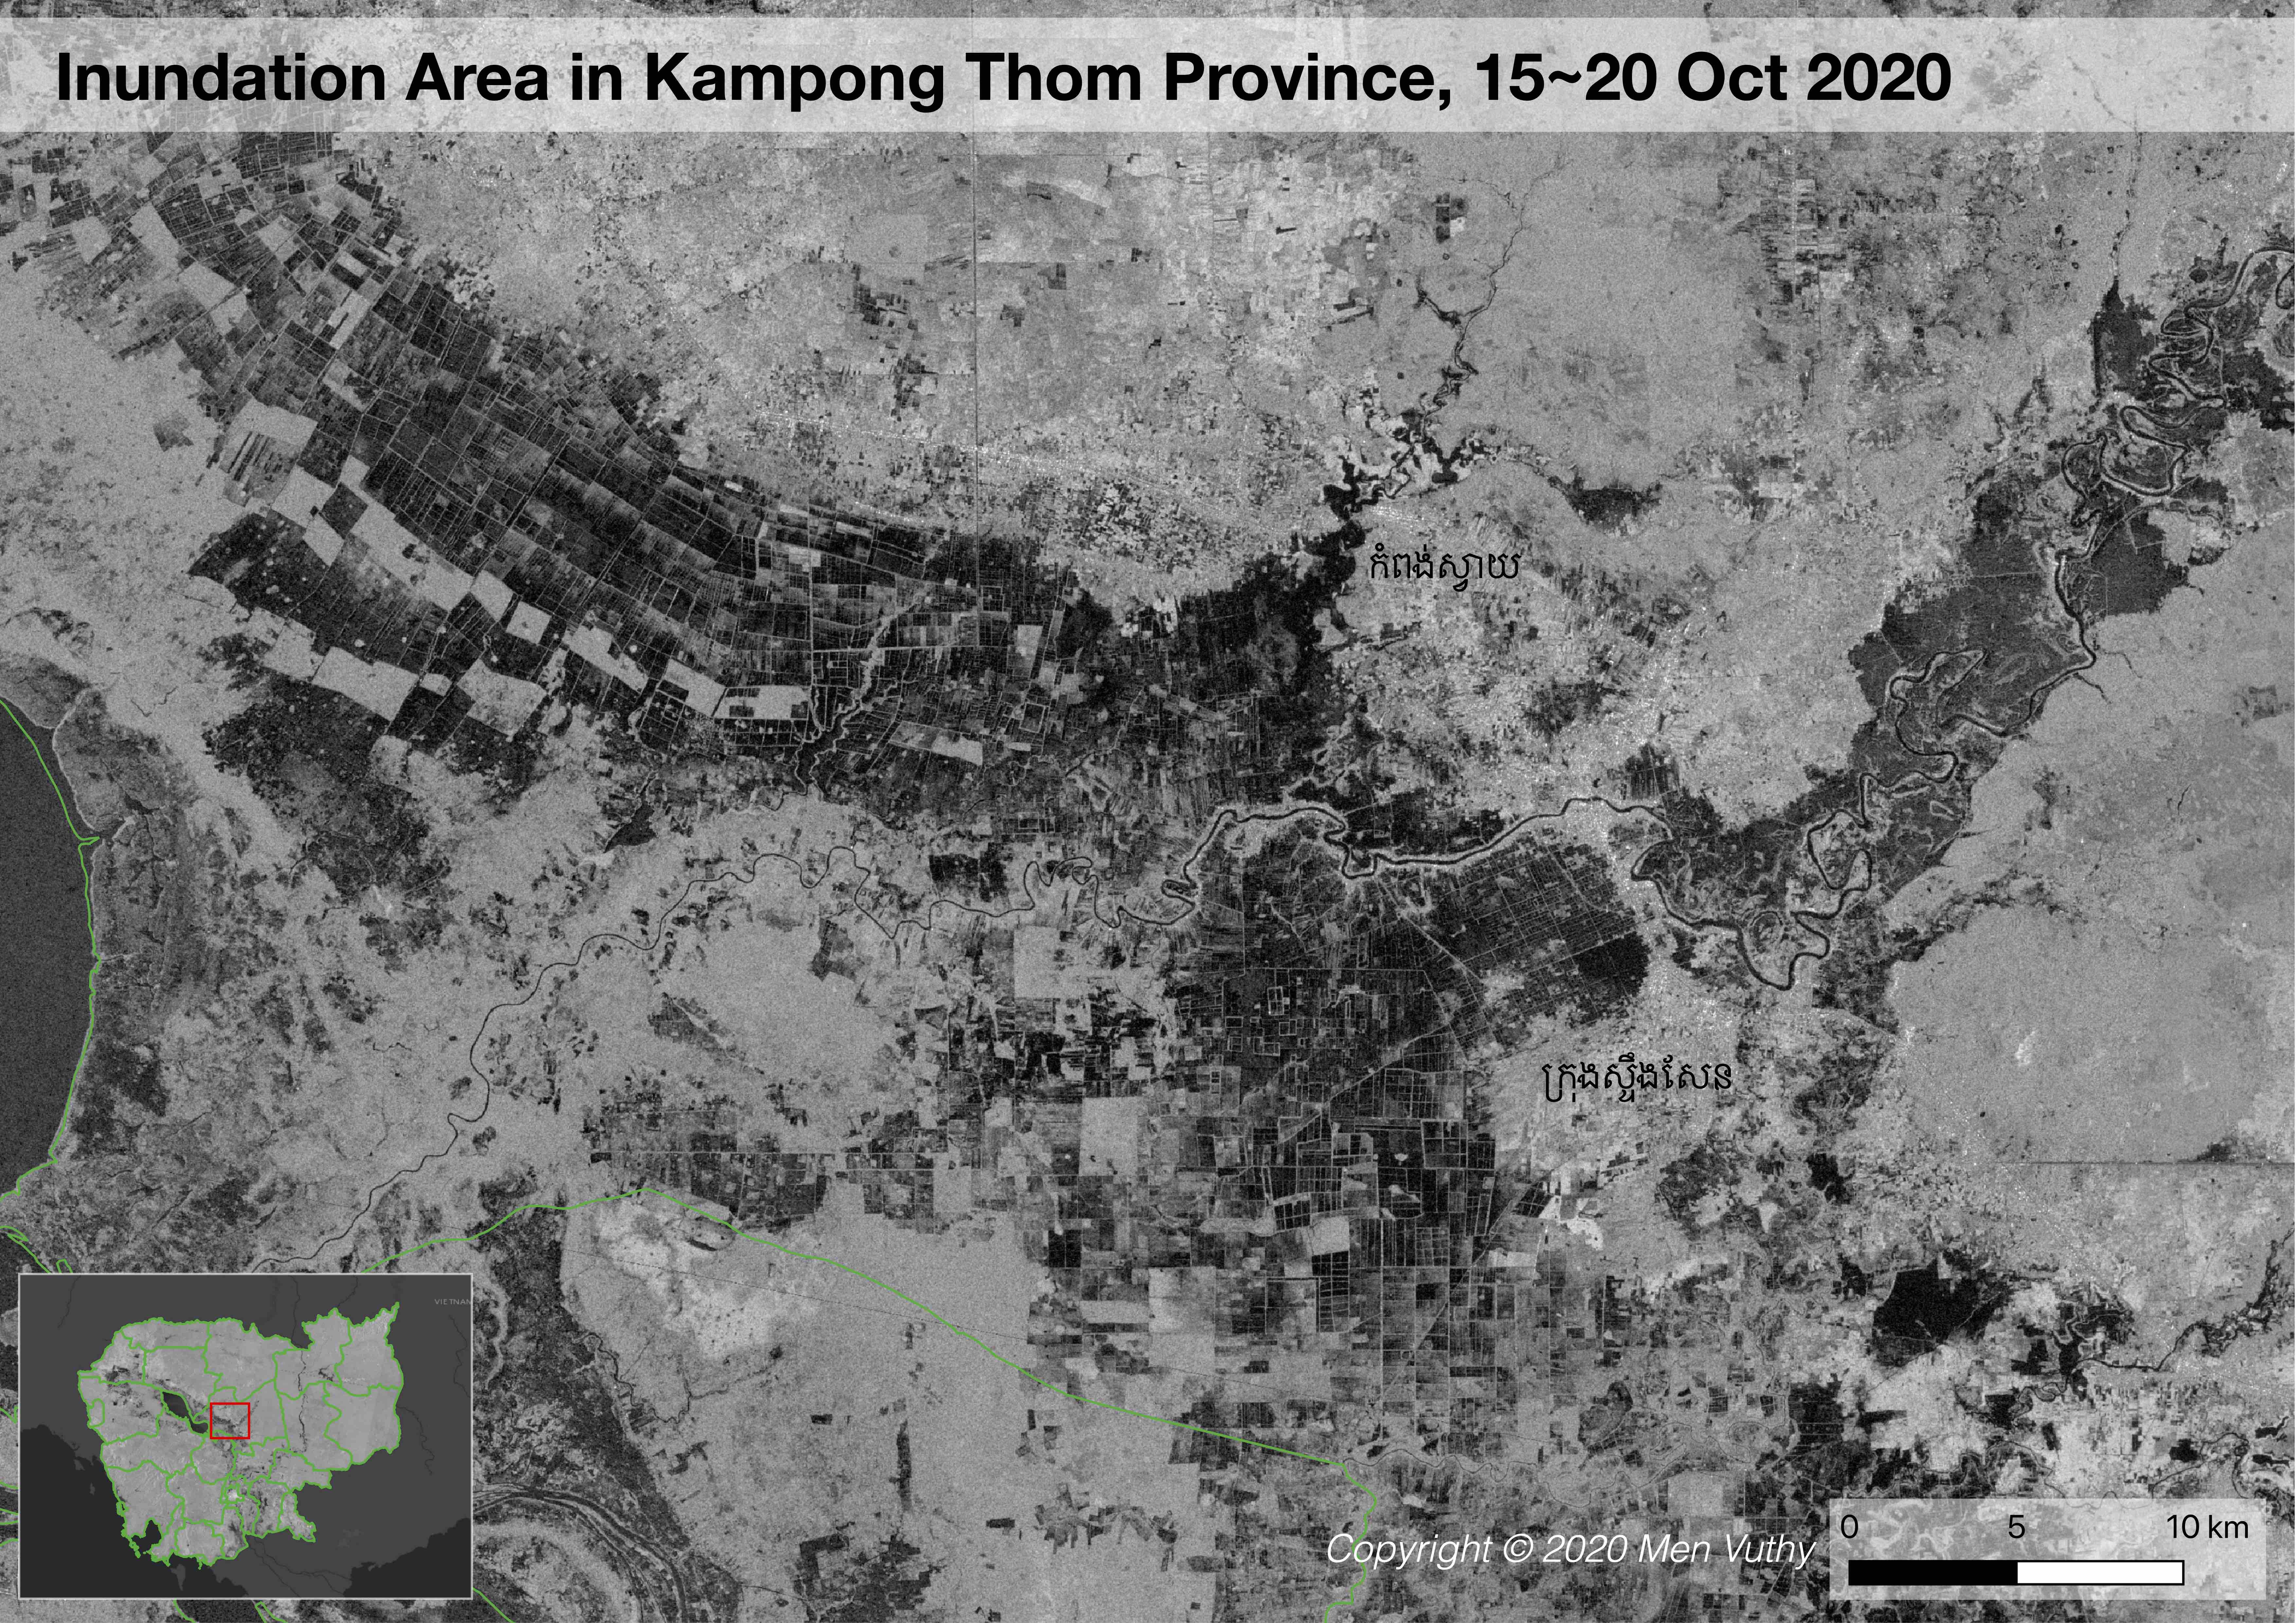
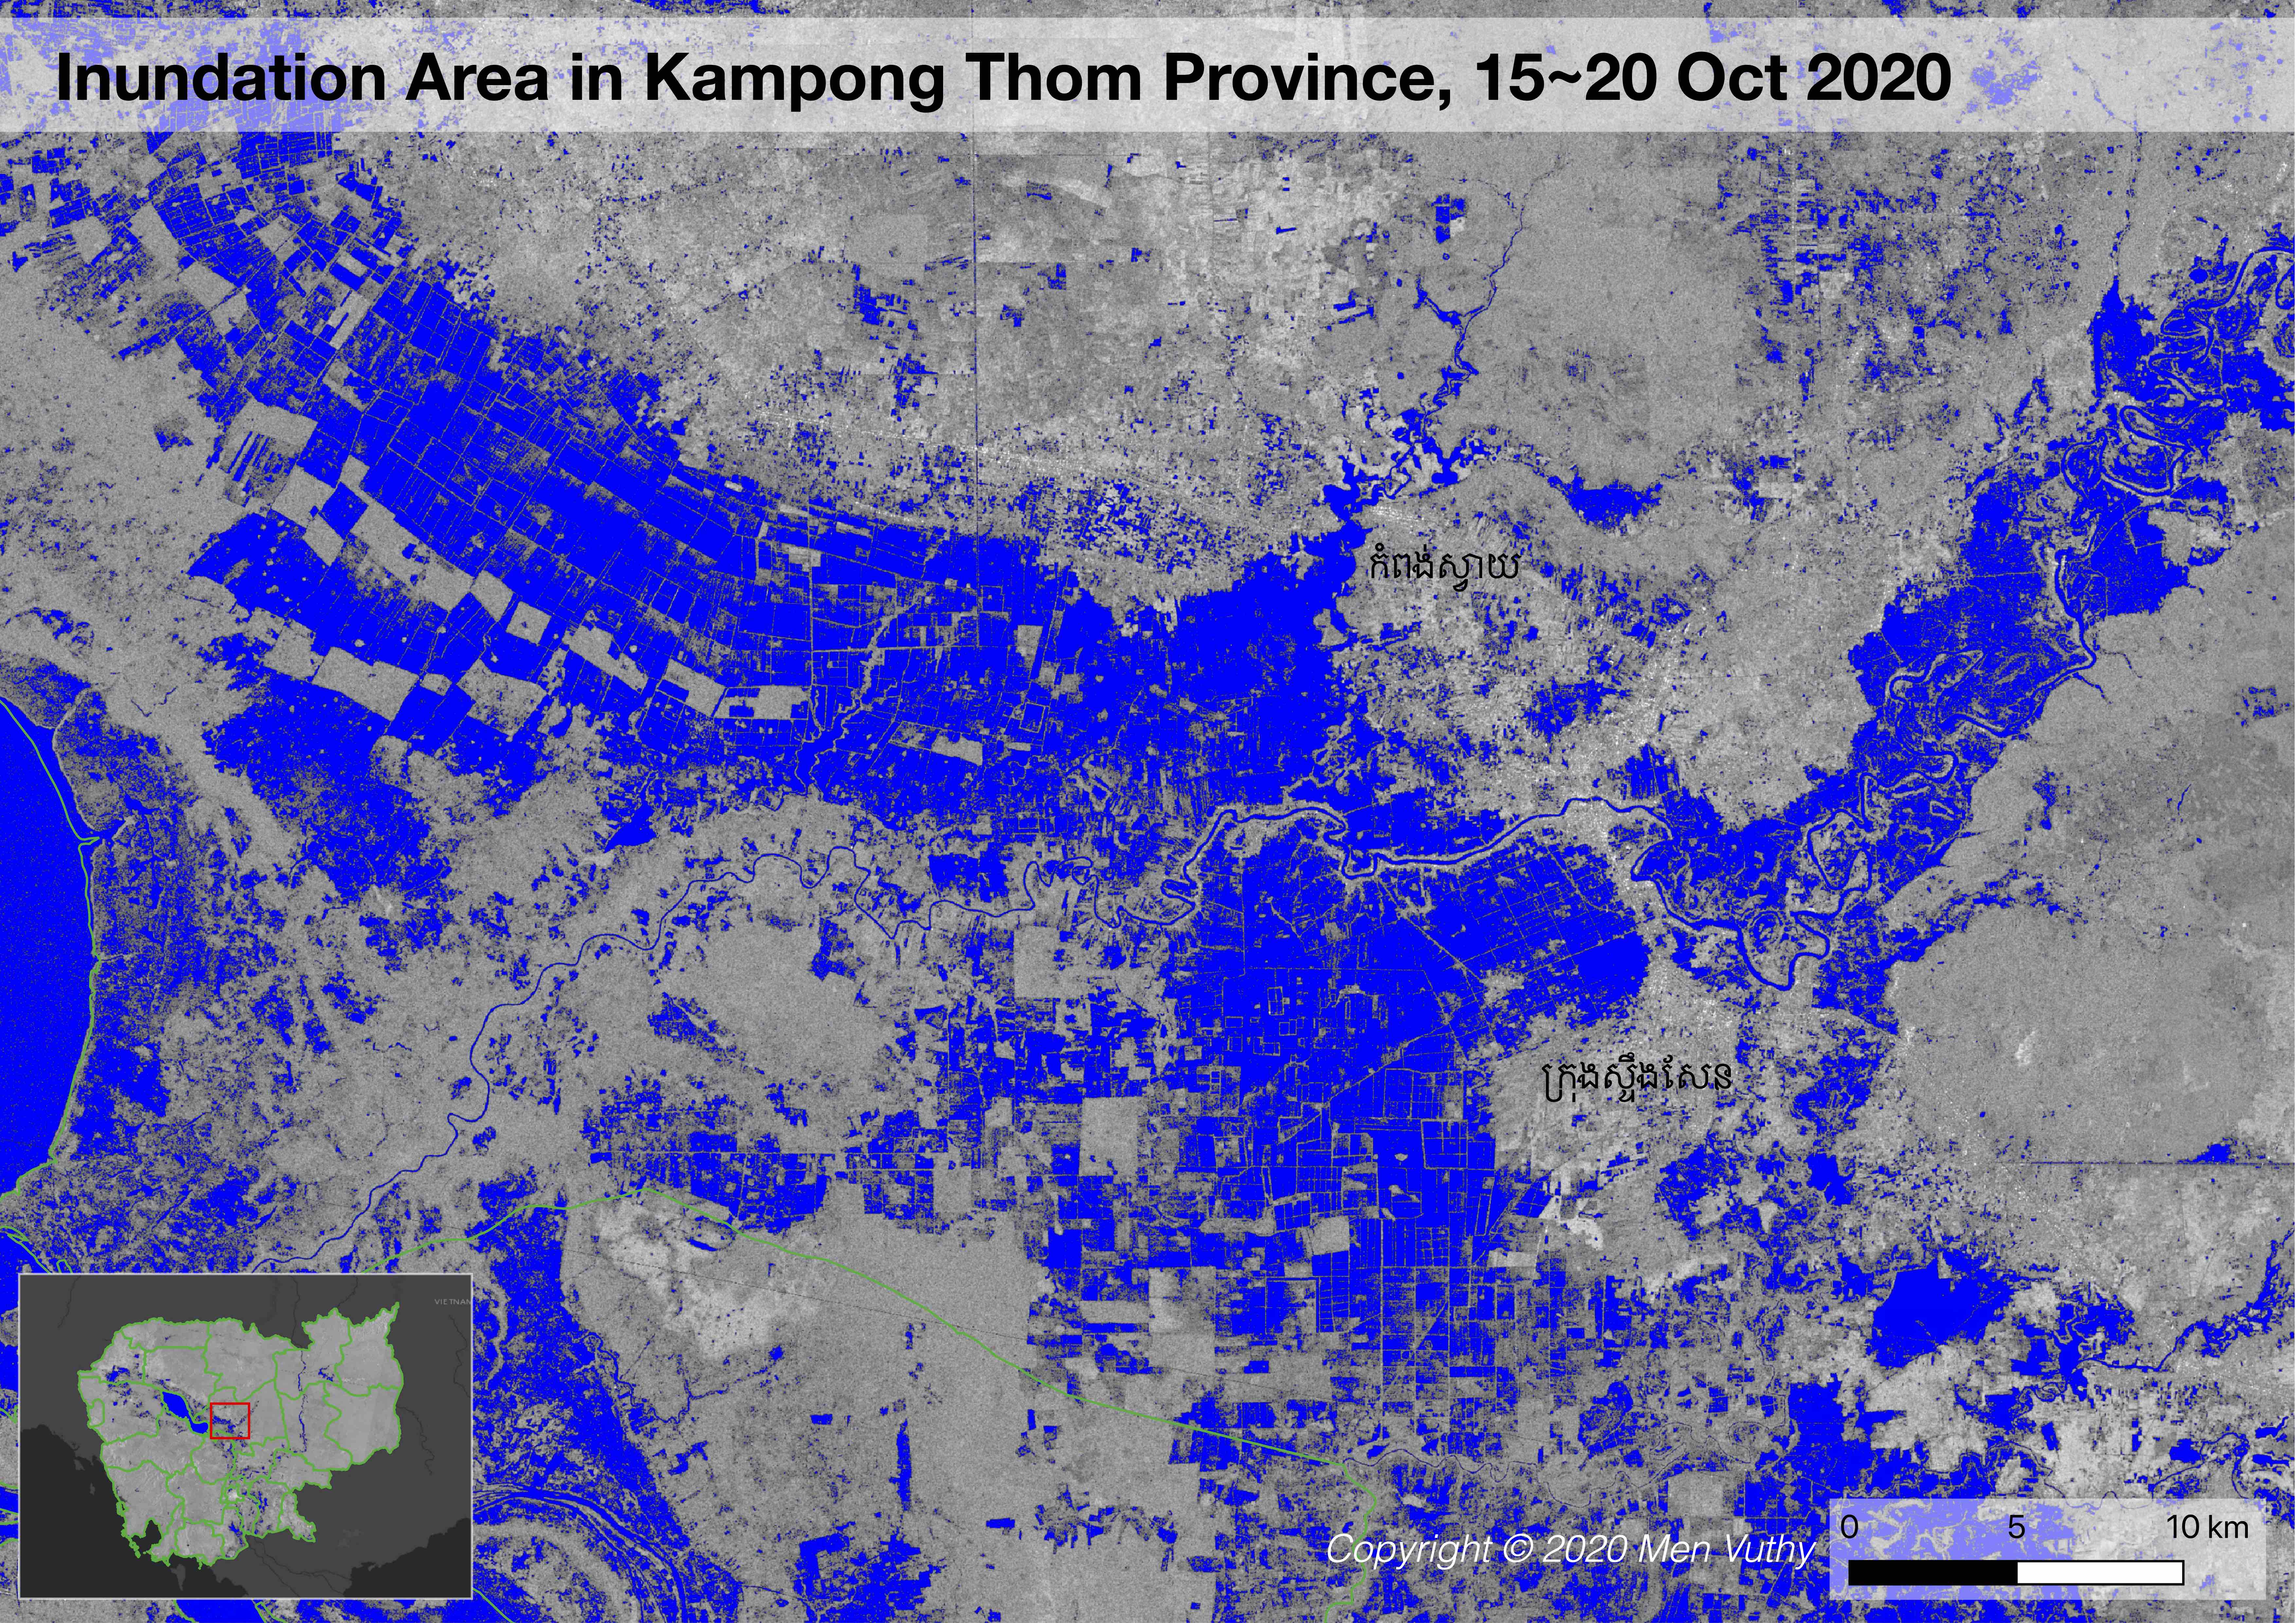
Kampong Thom
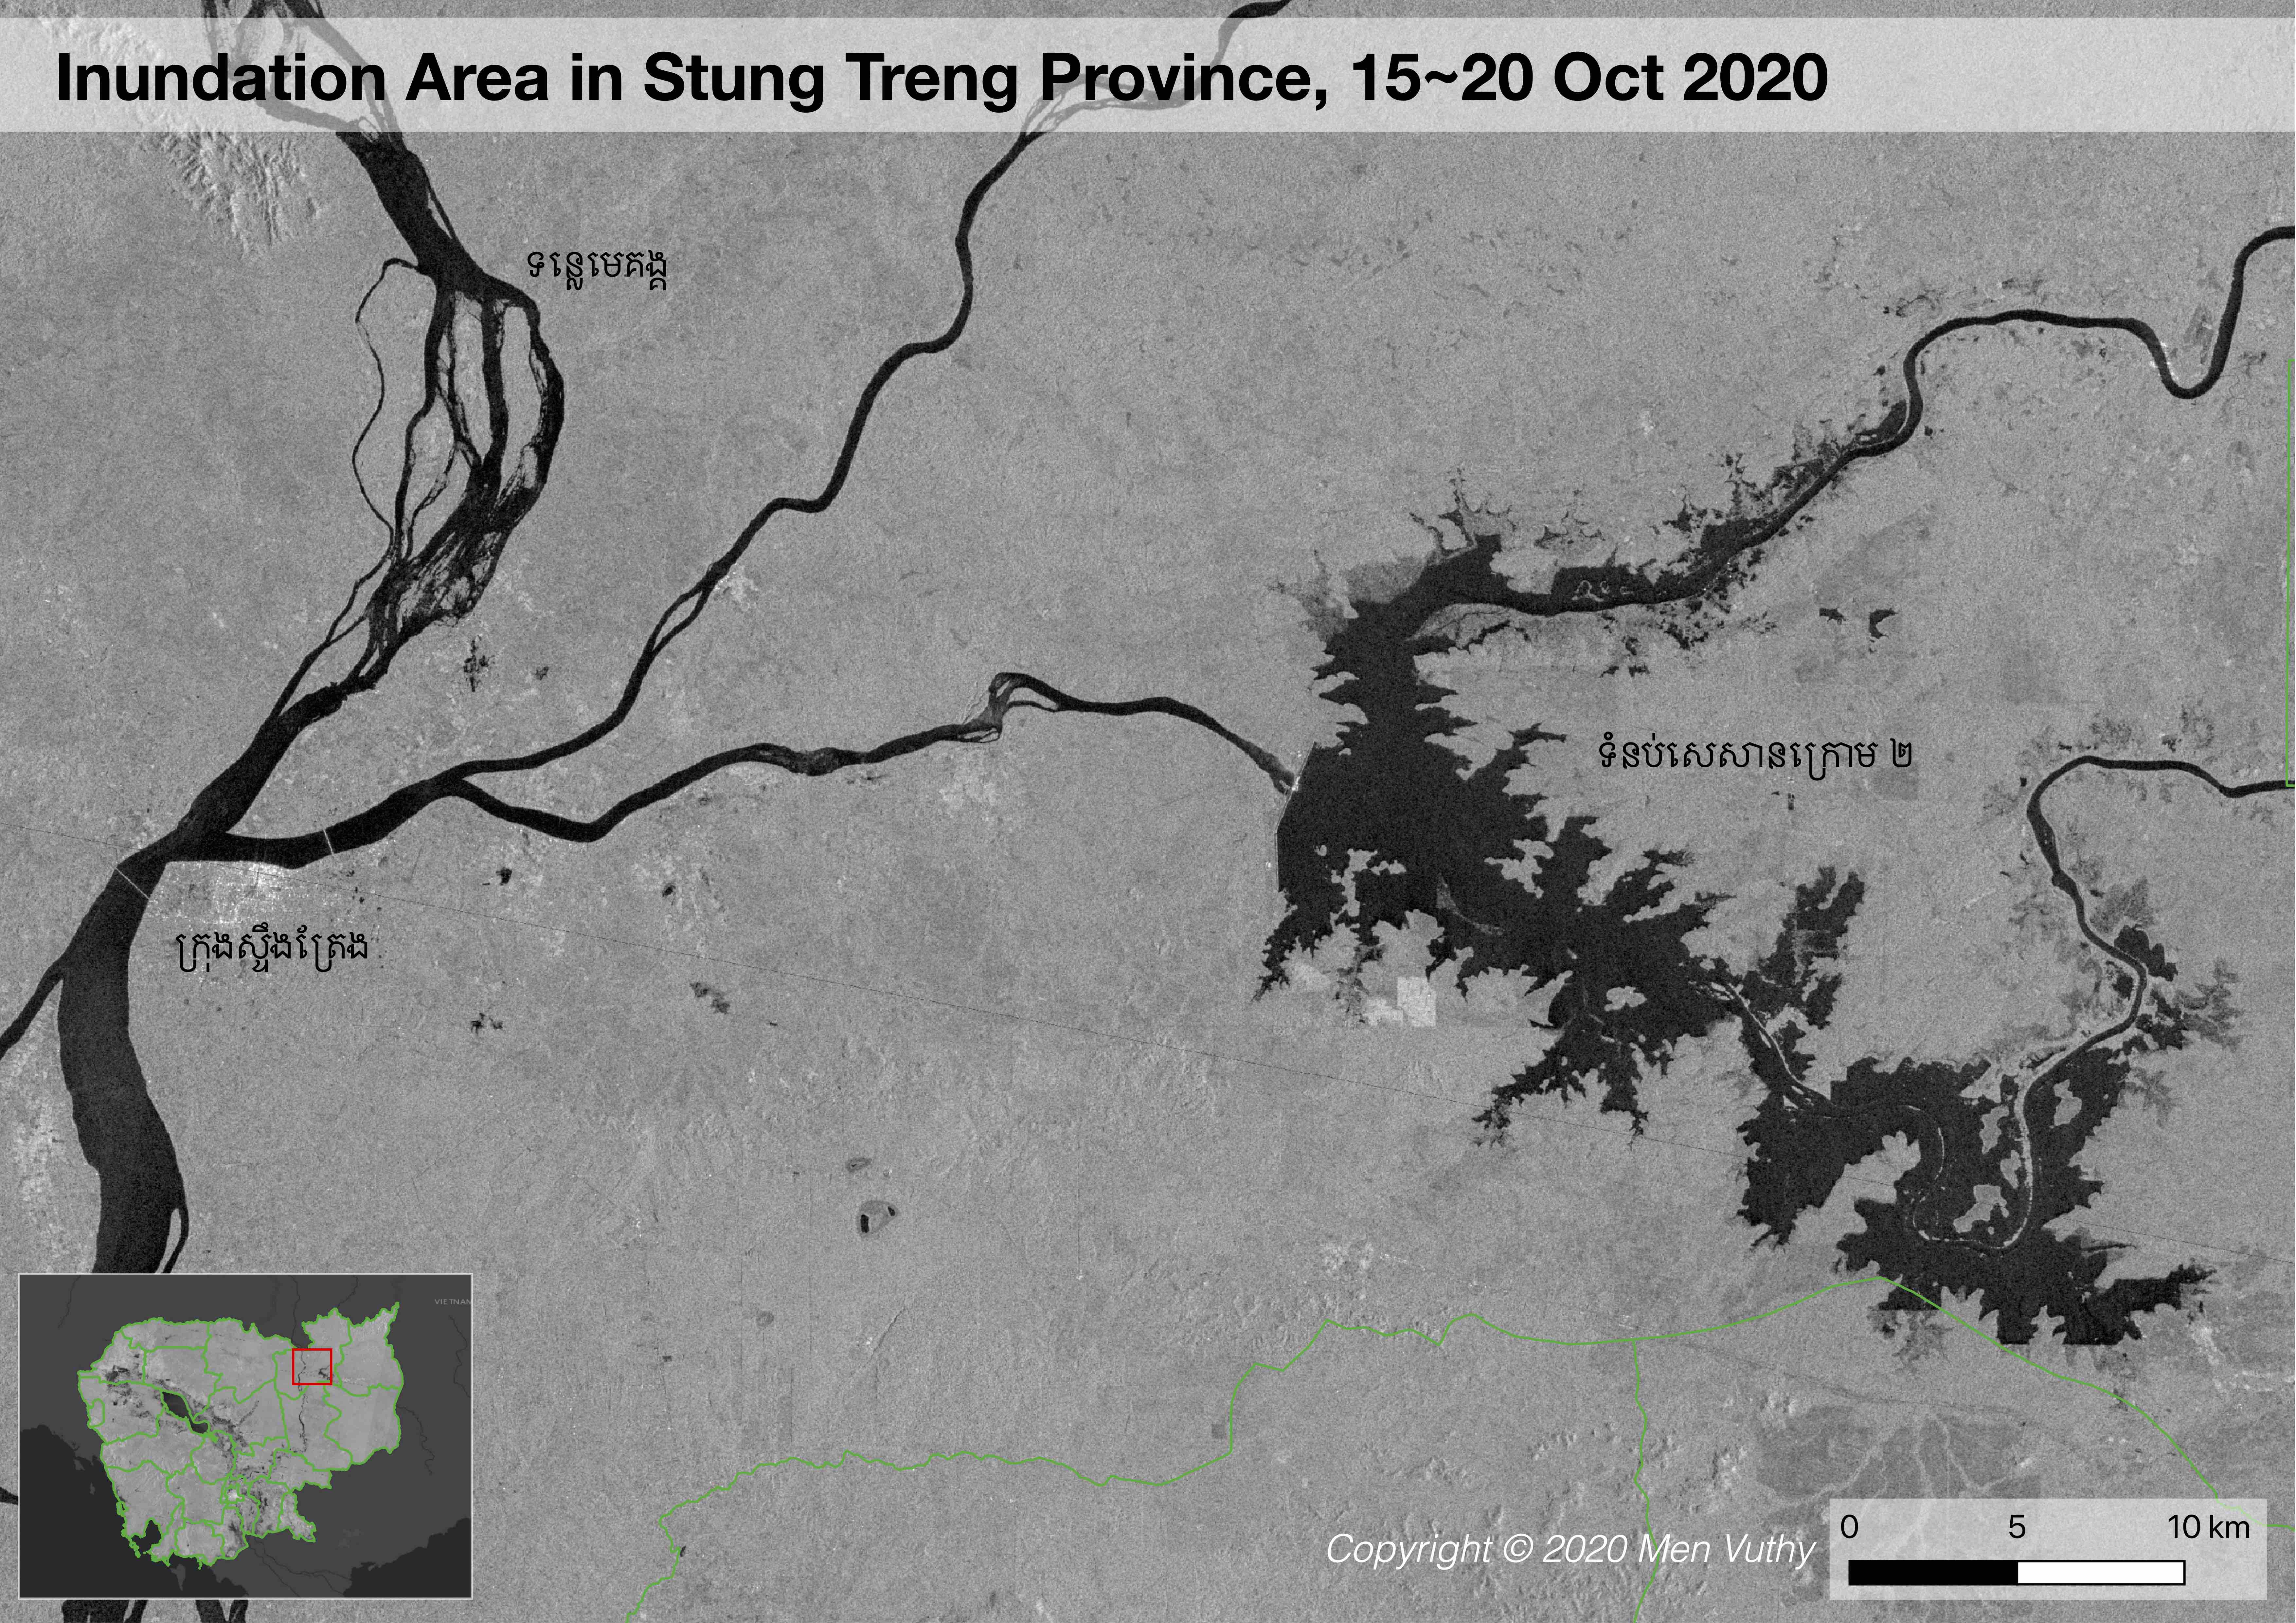
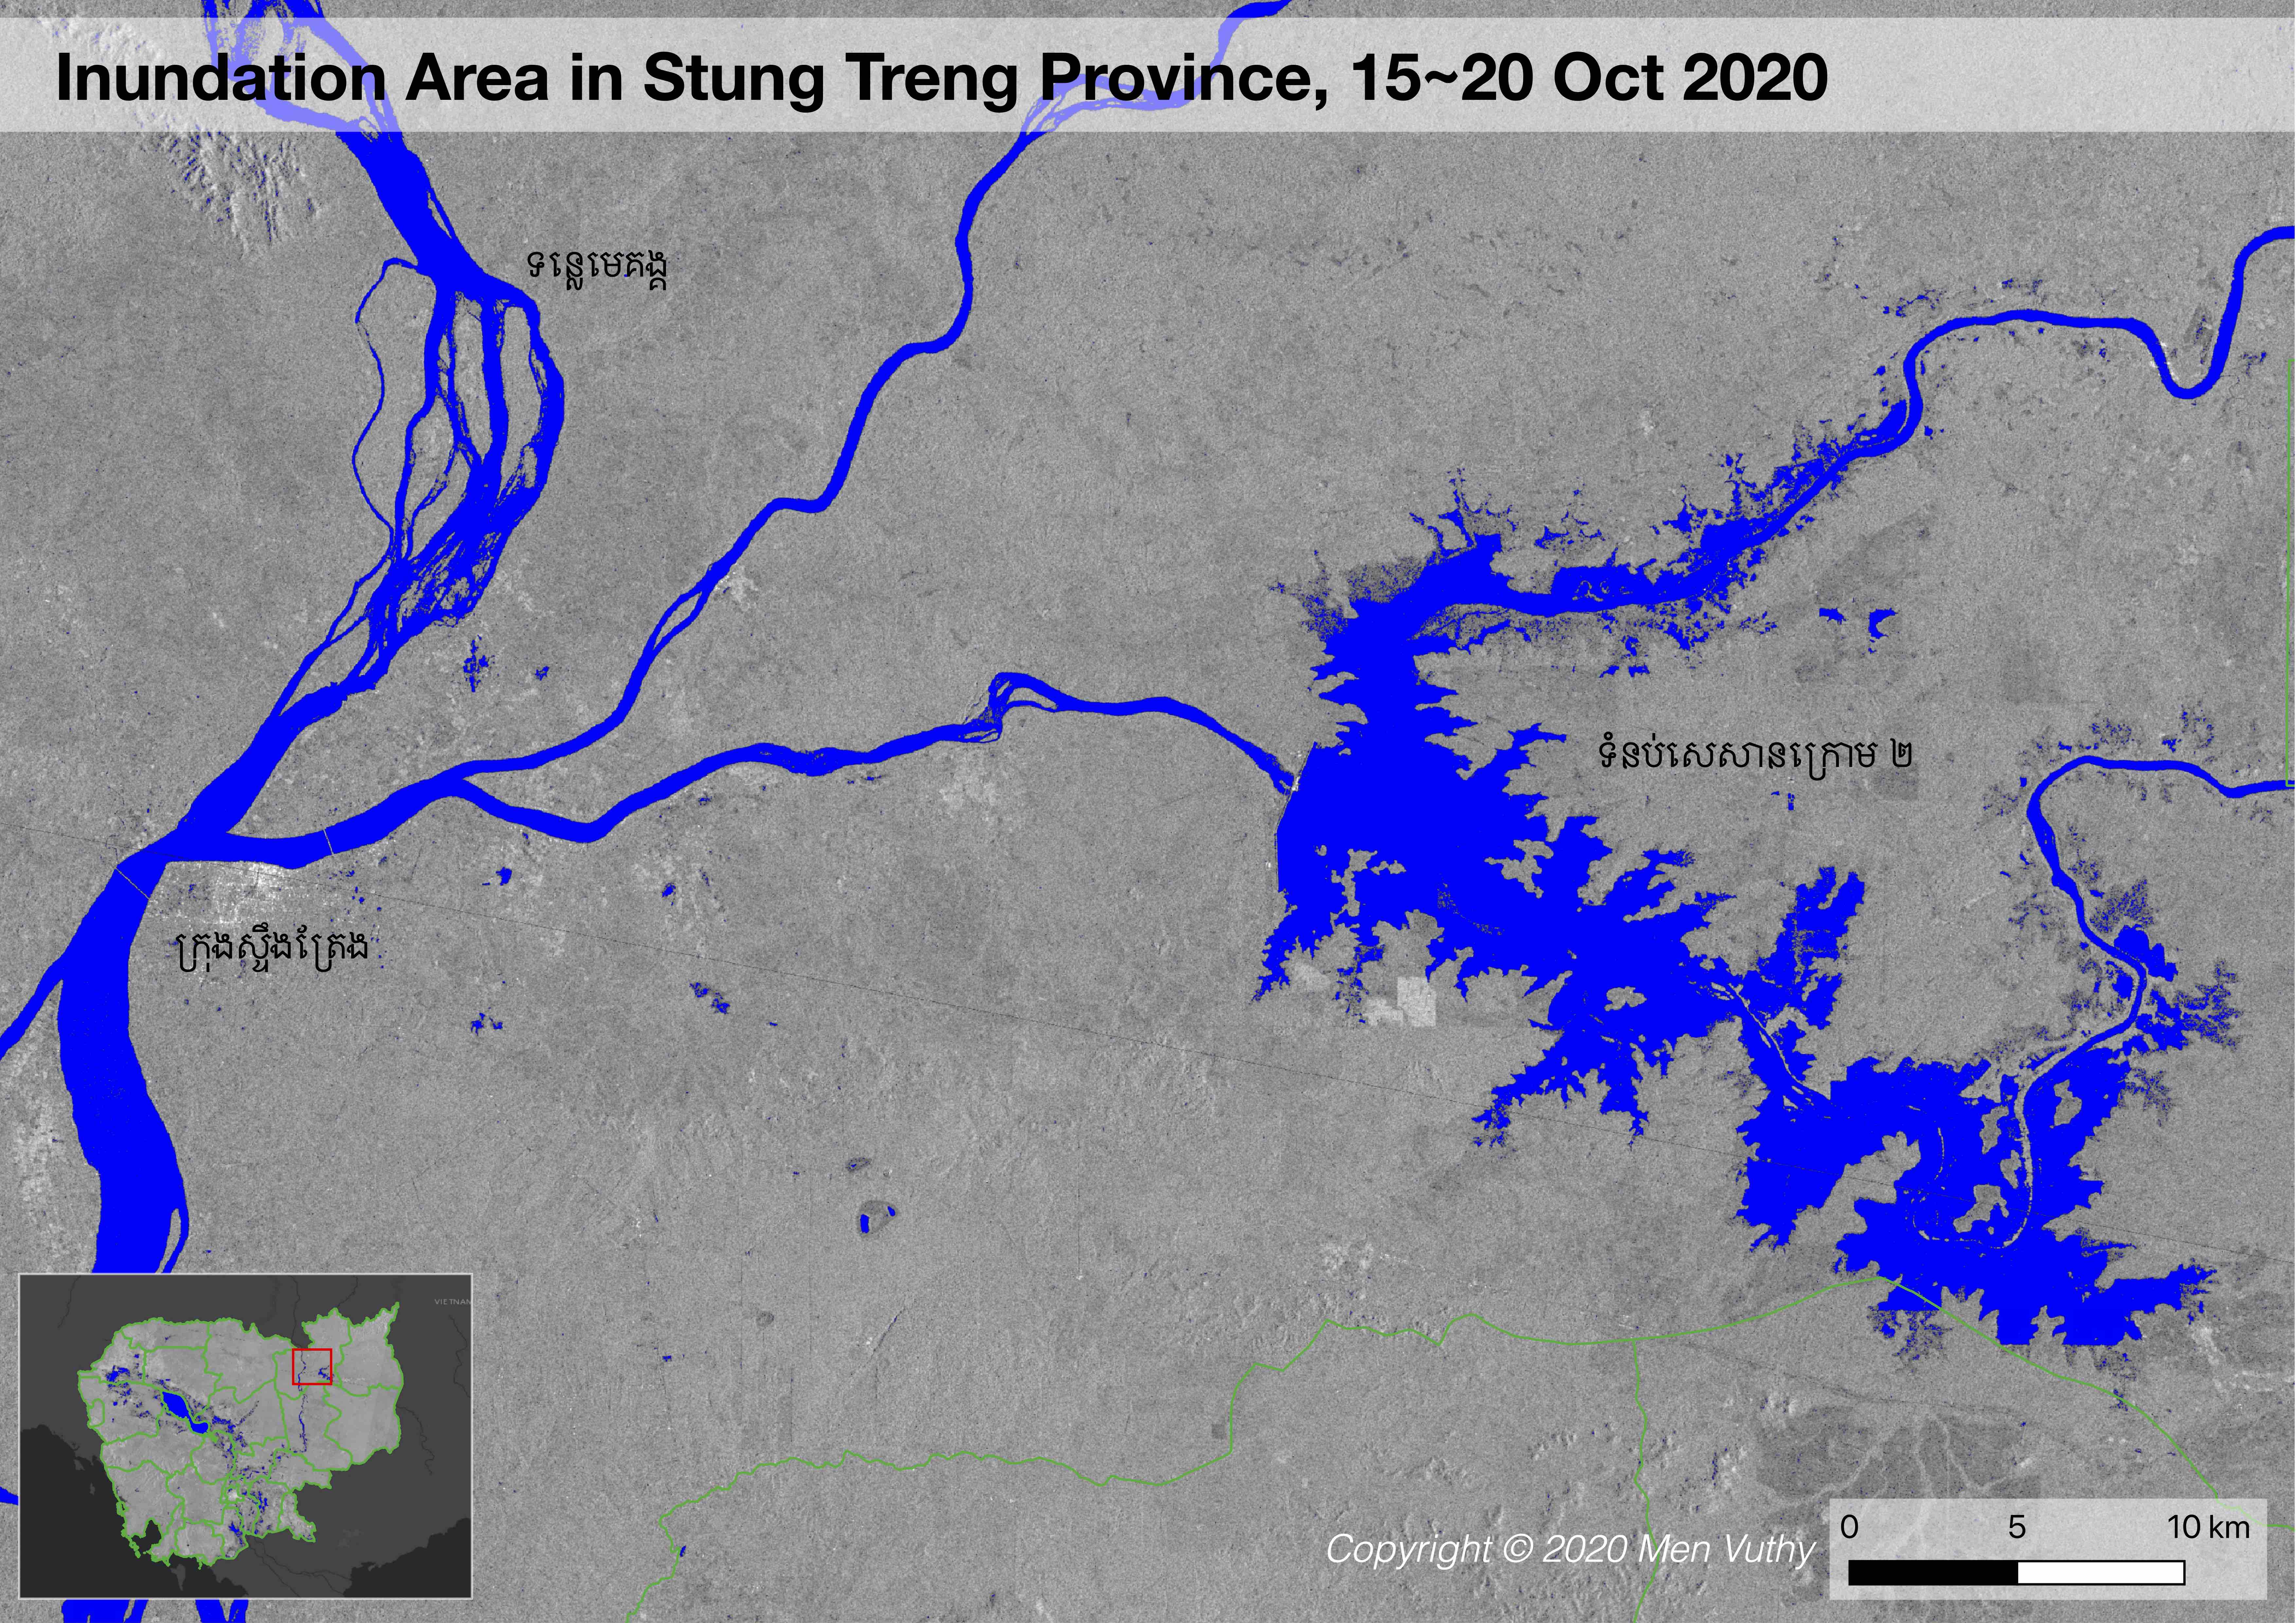
Stung Treng
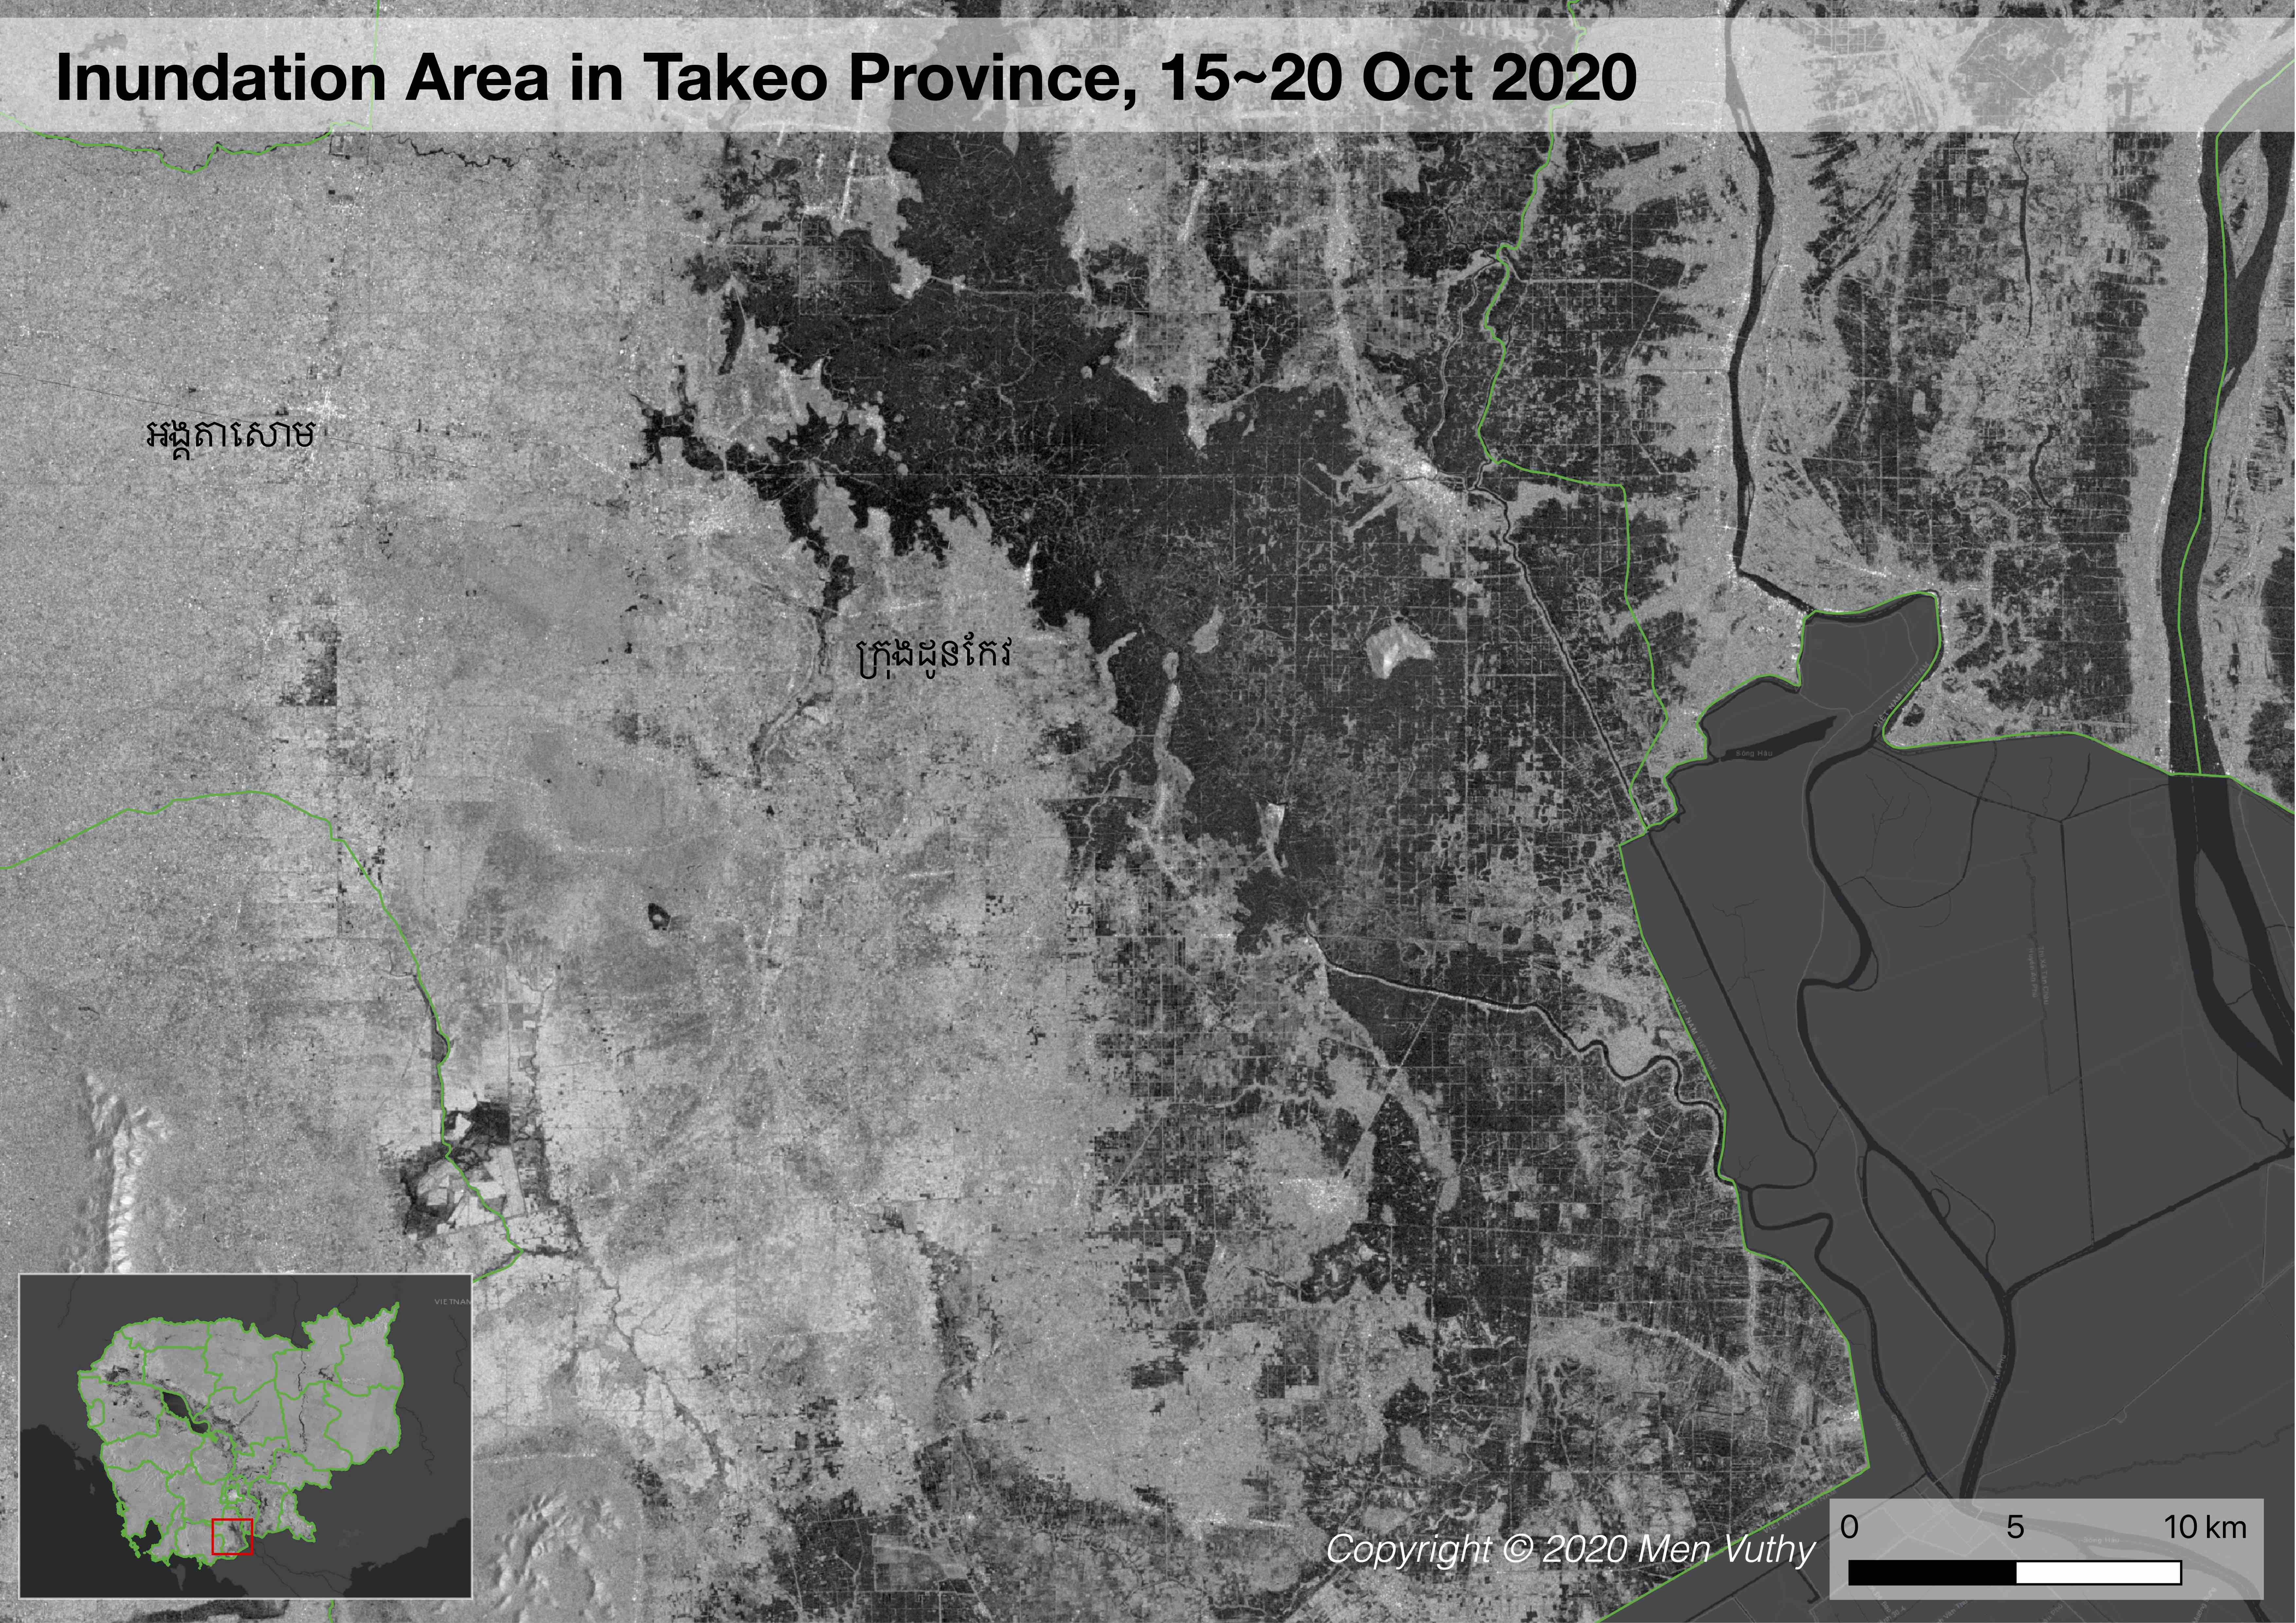
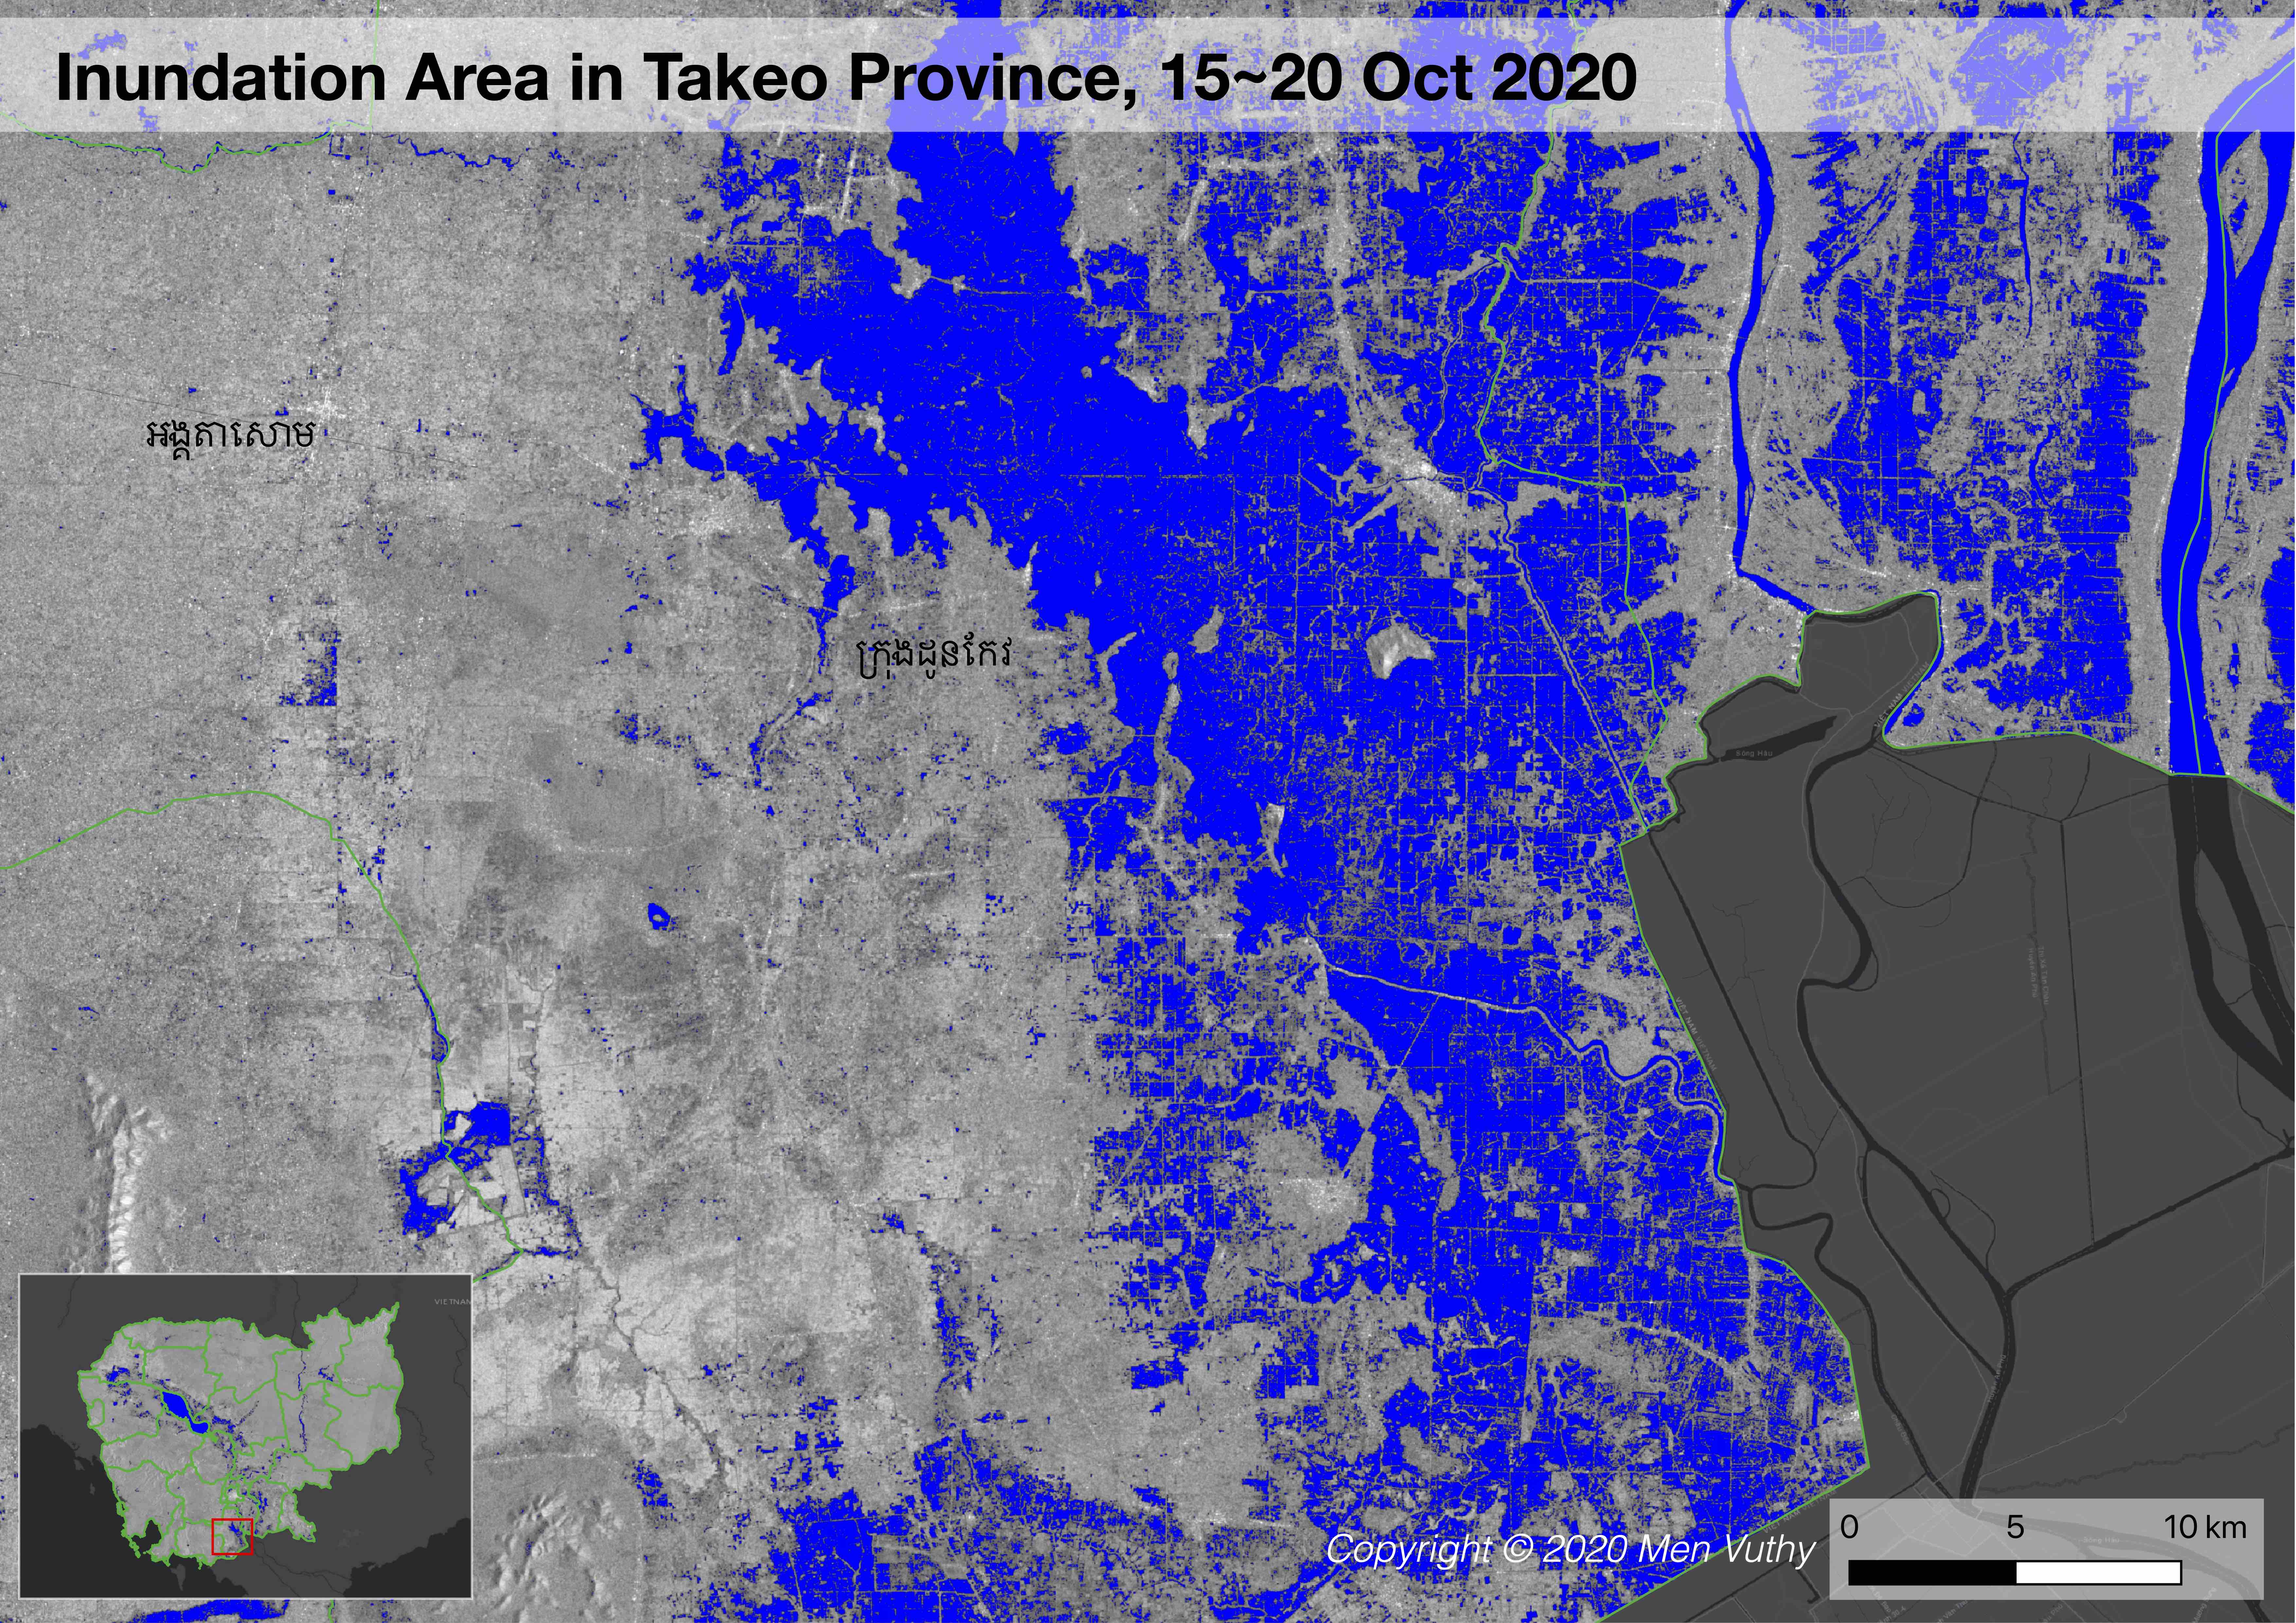
Takeo
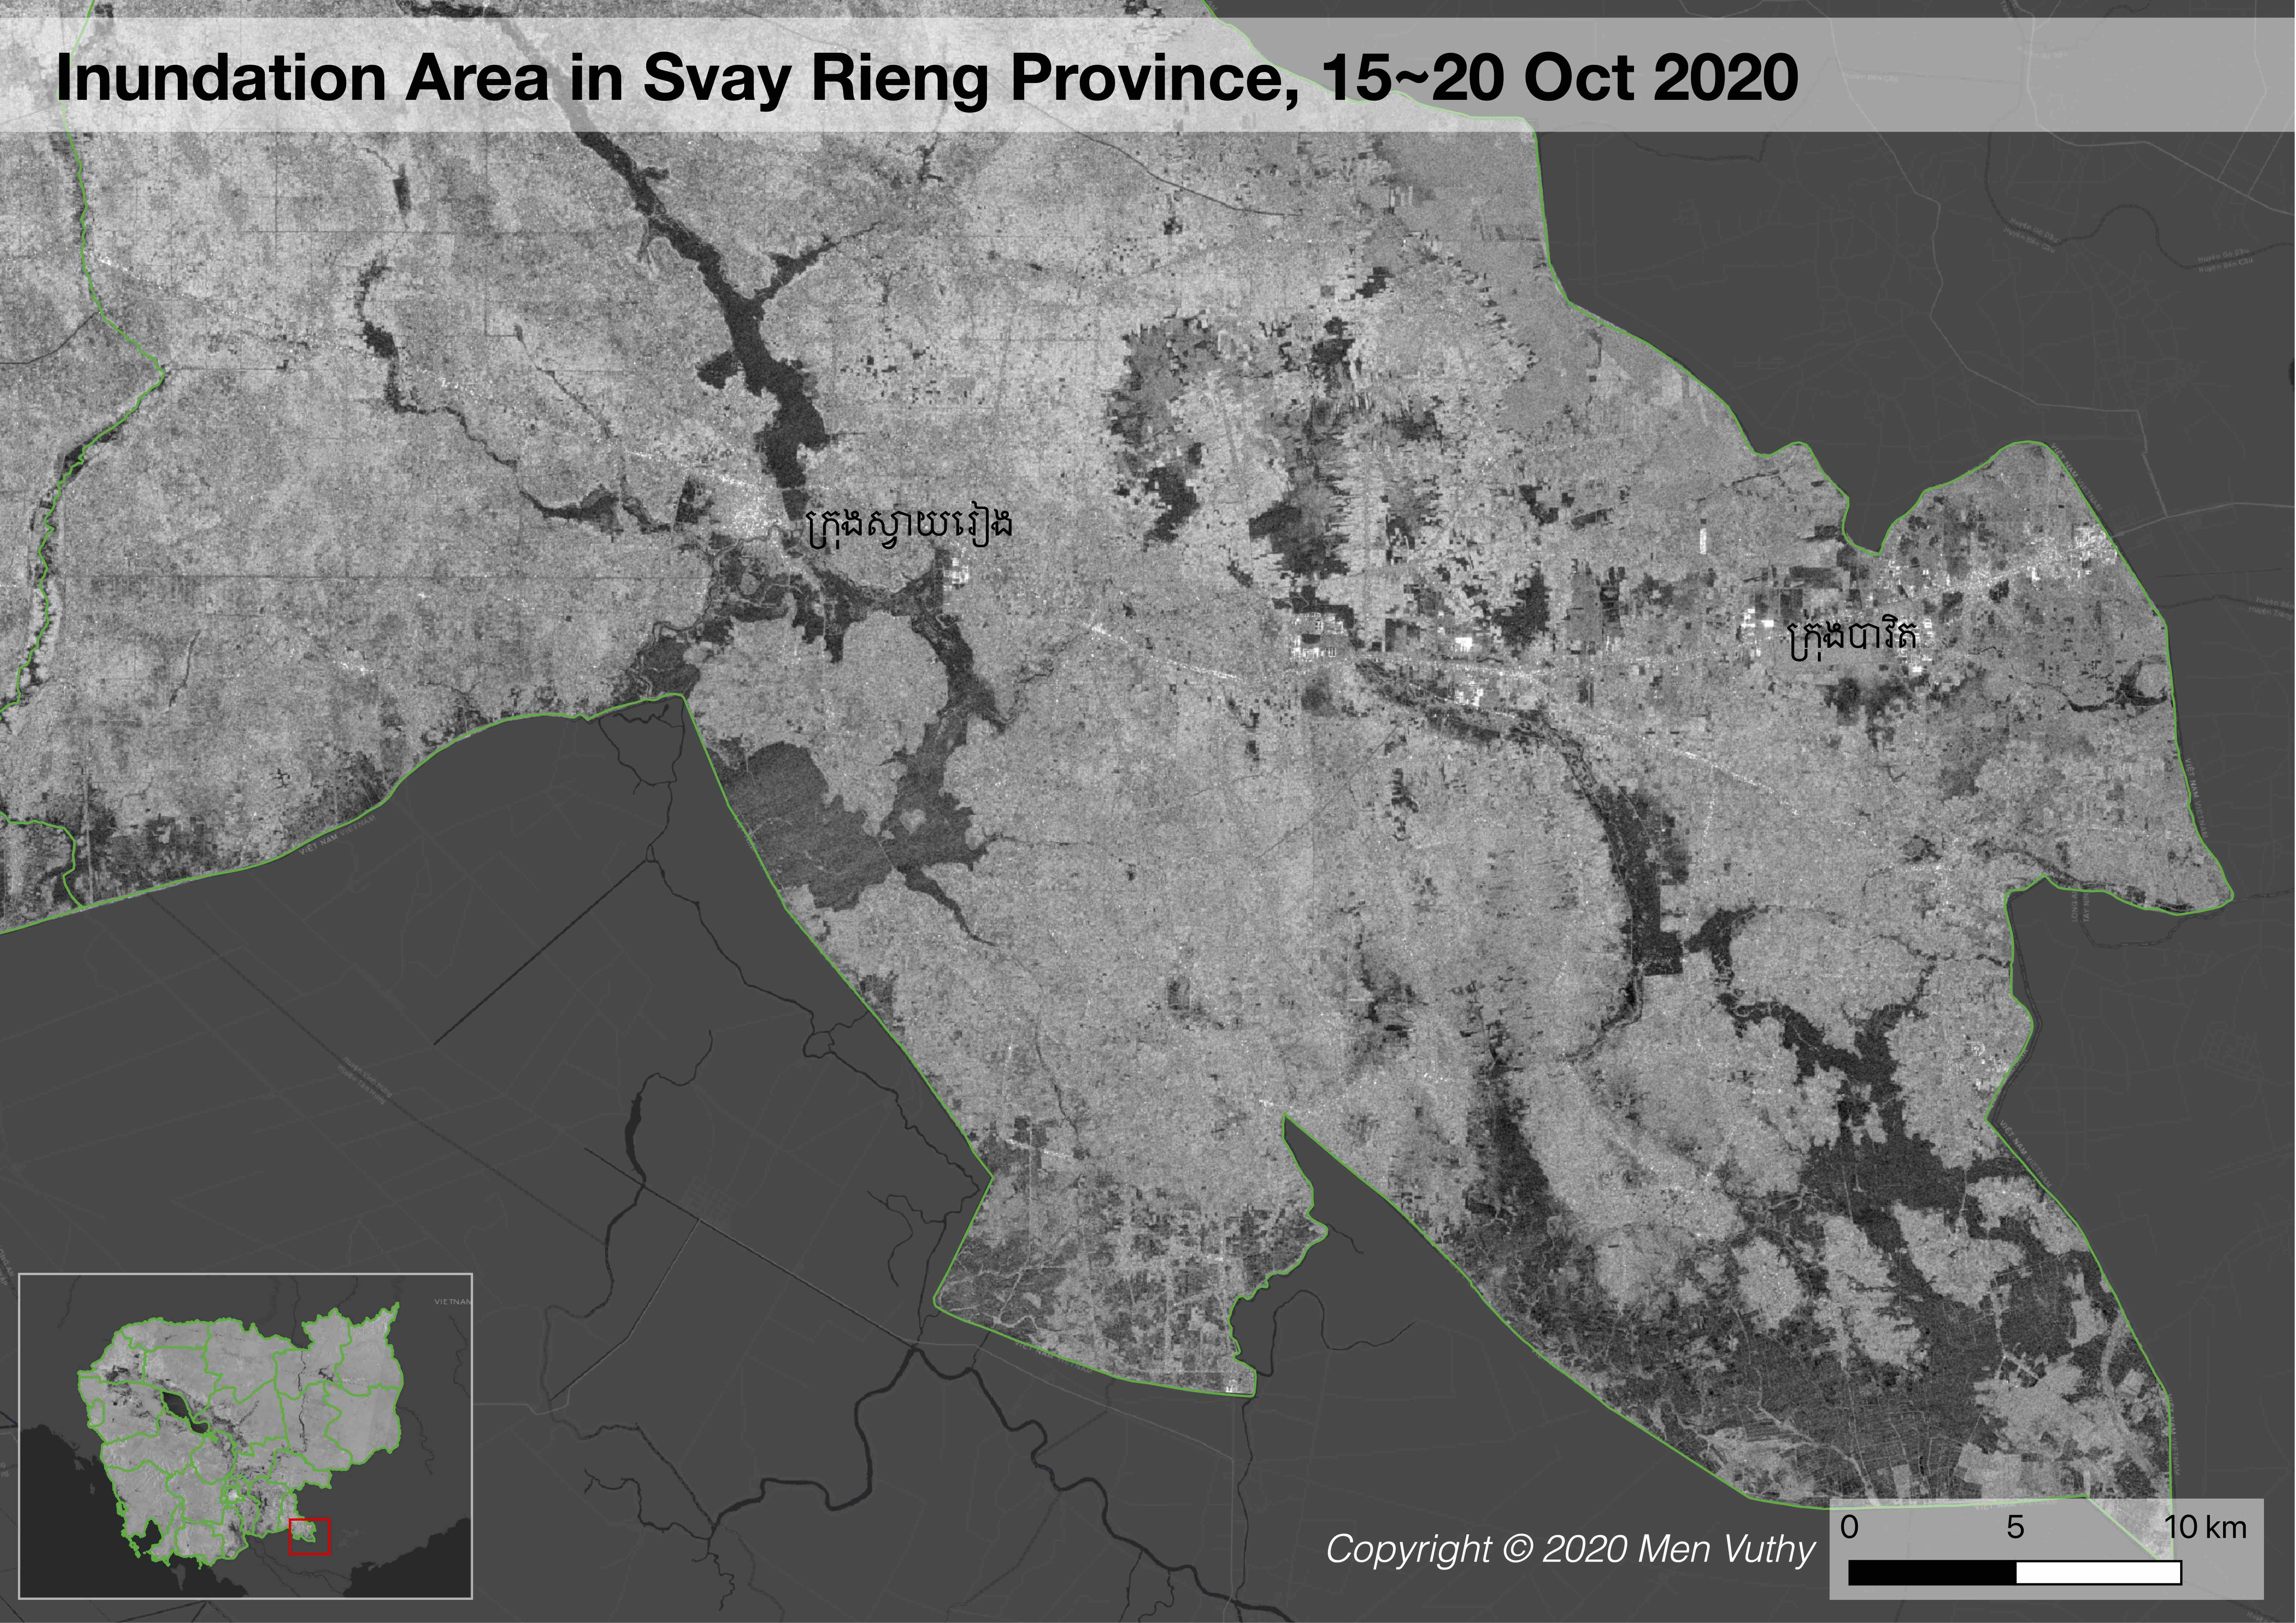
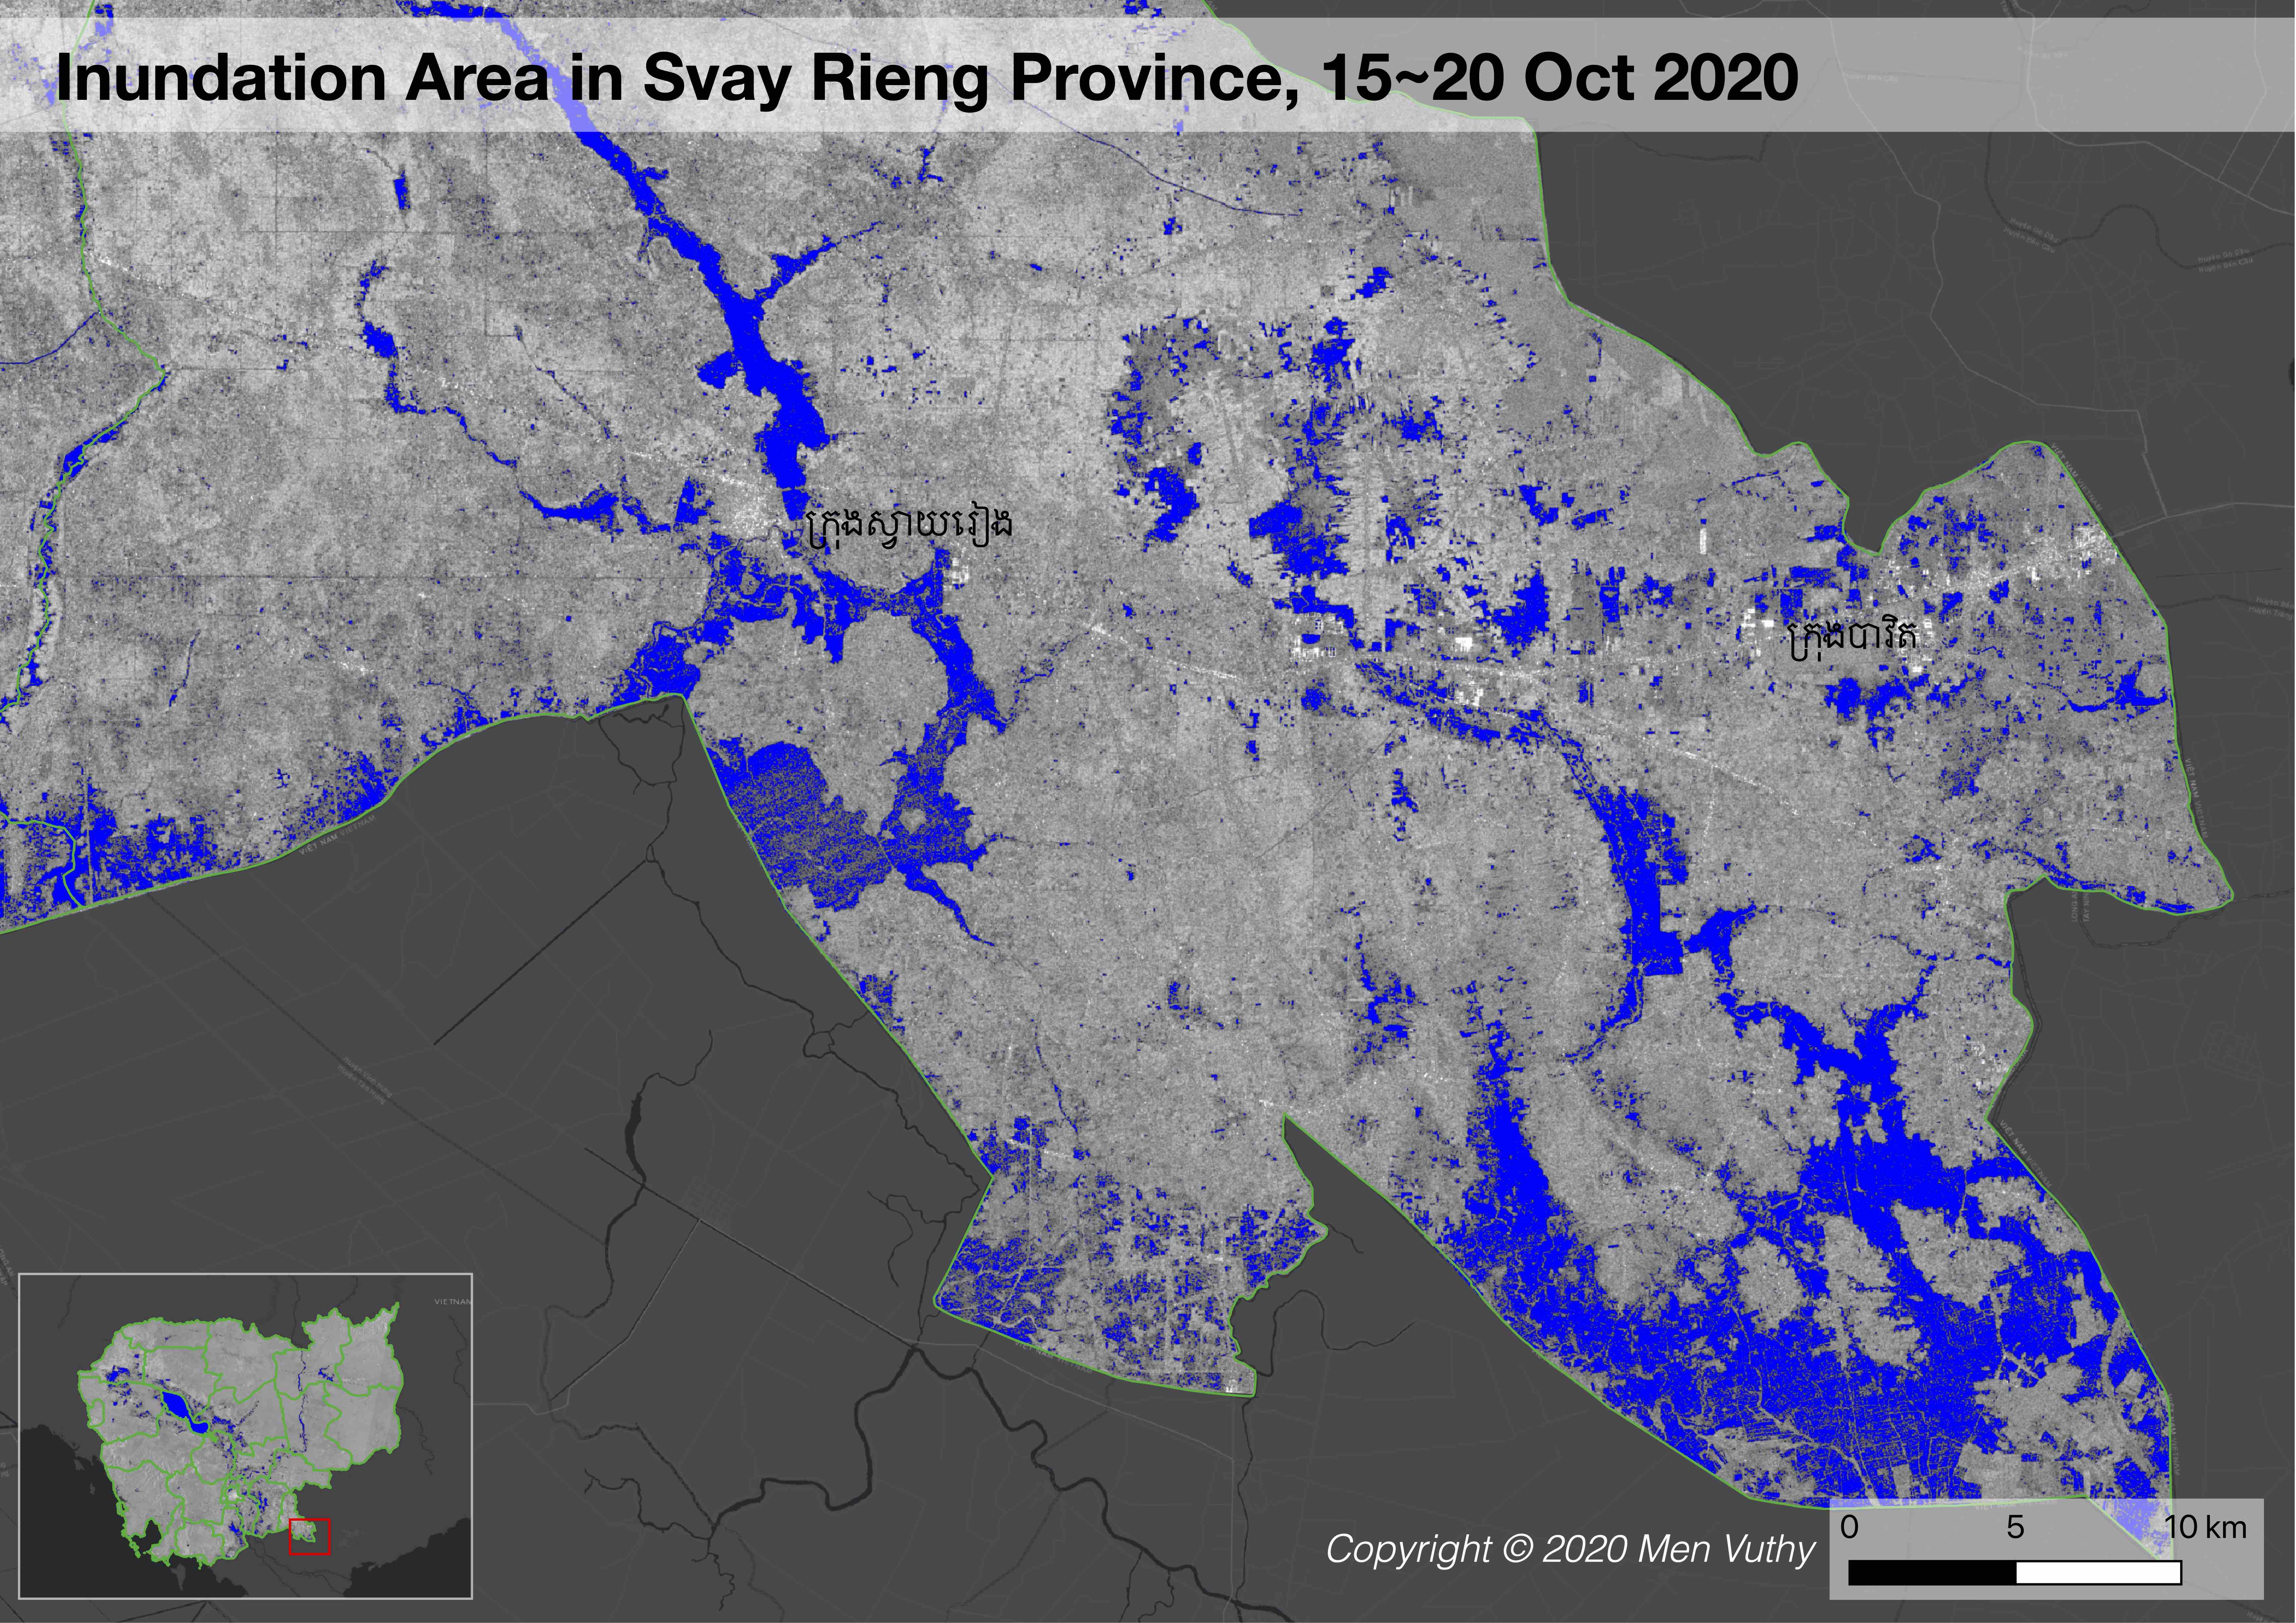
Svay Rieng
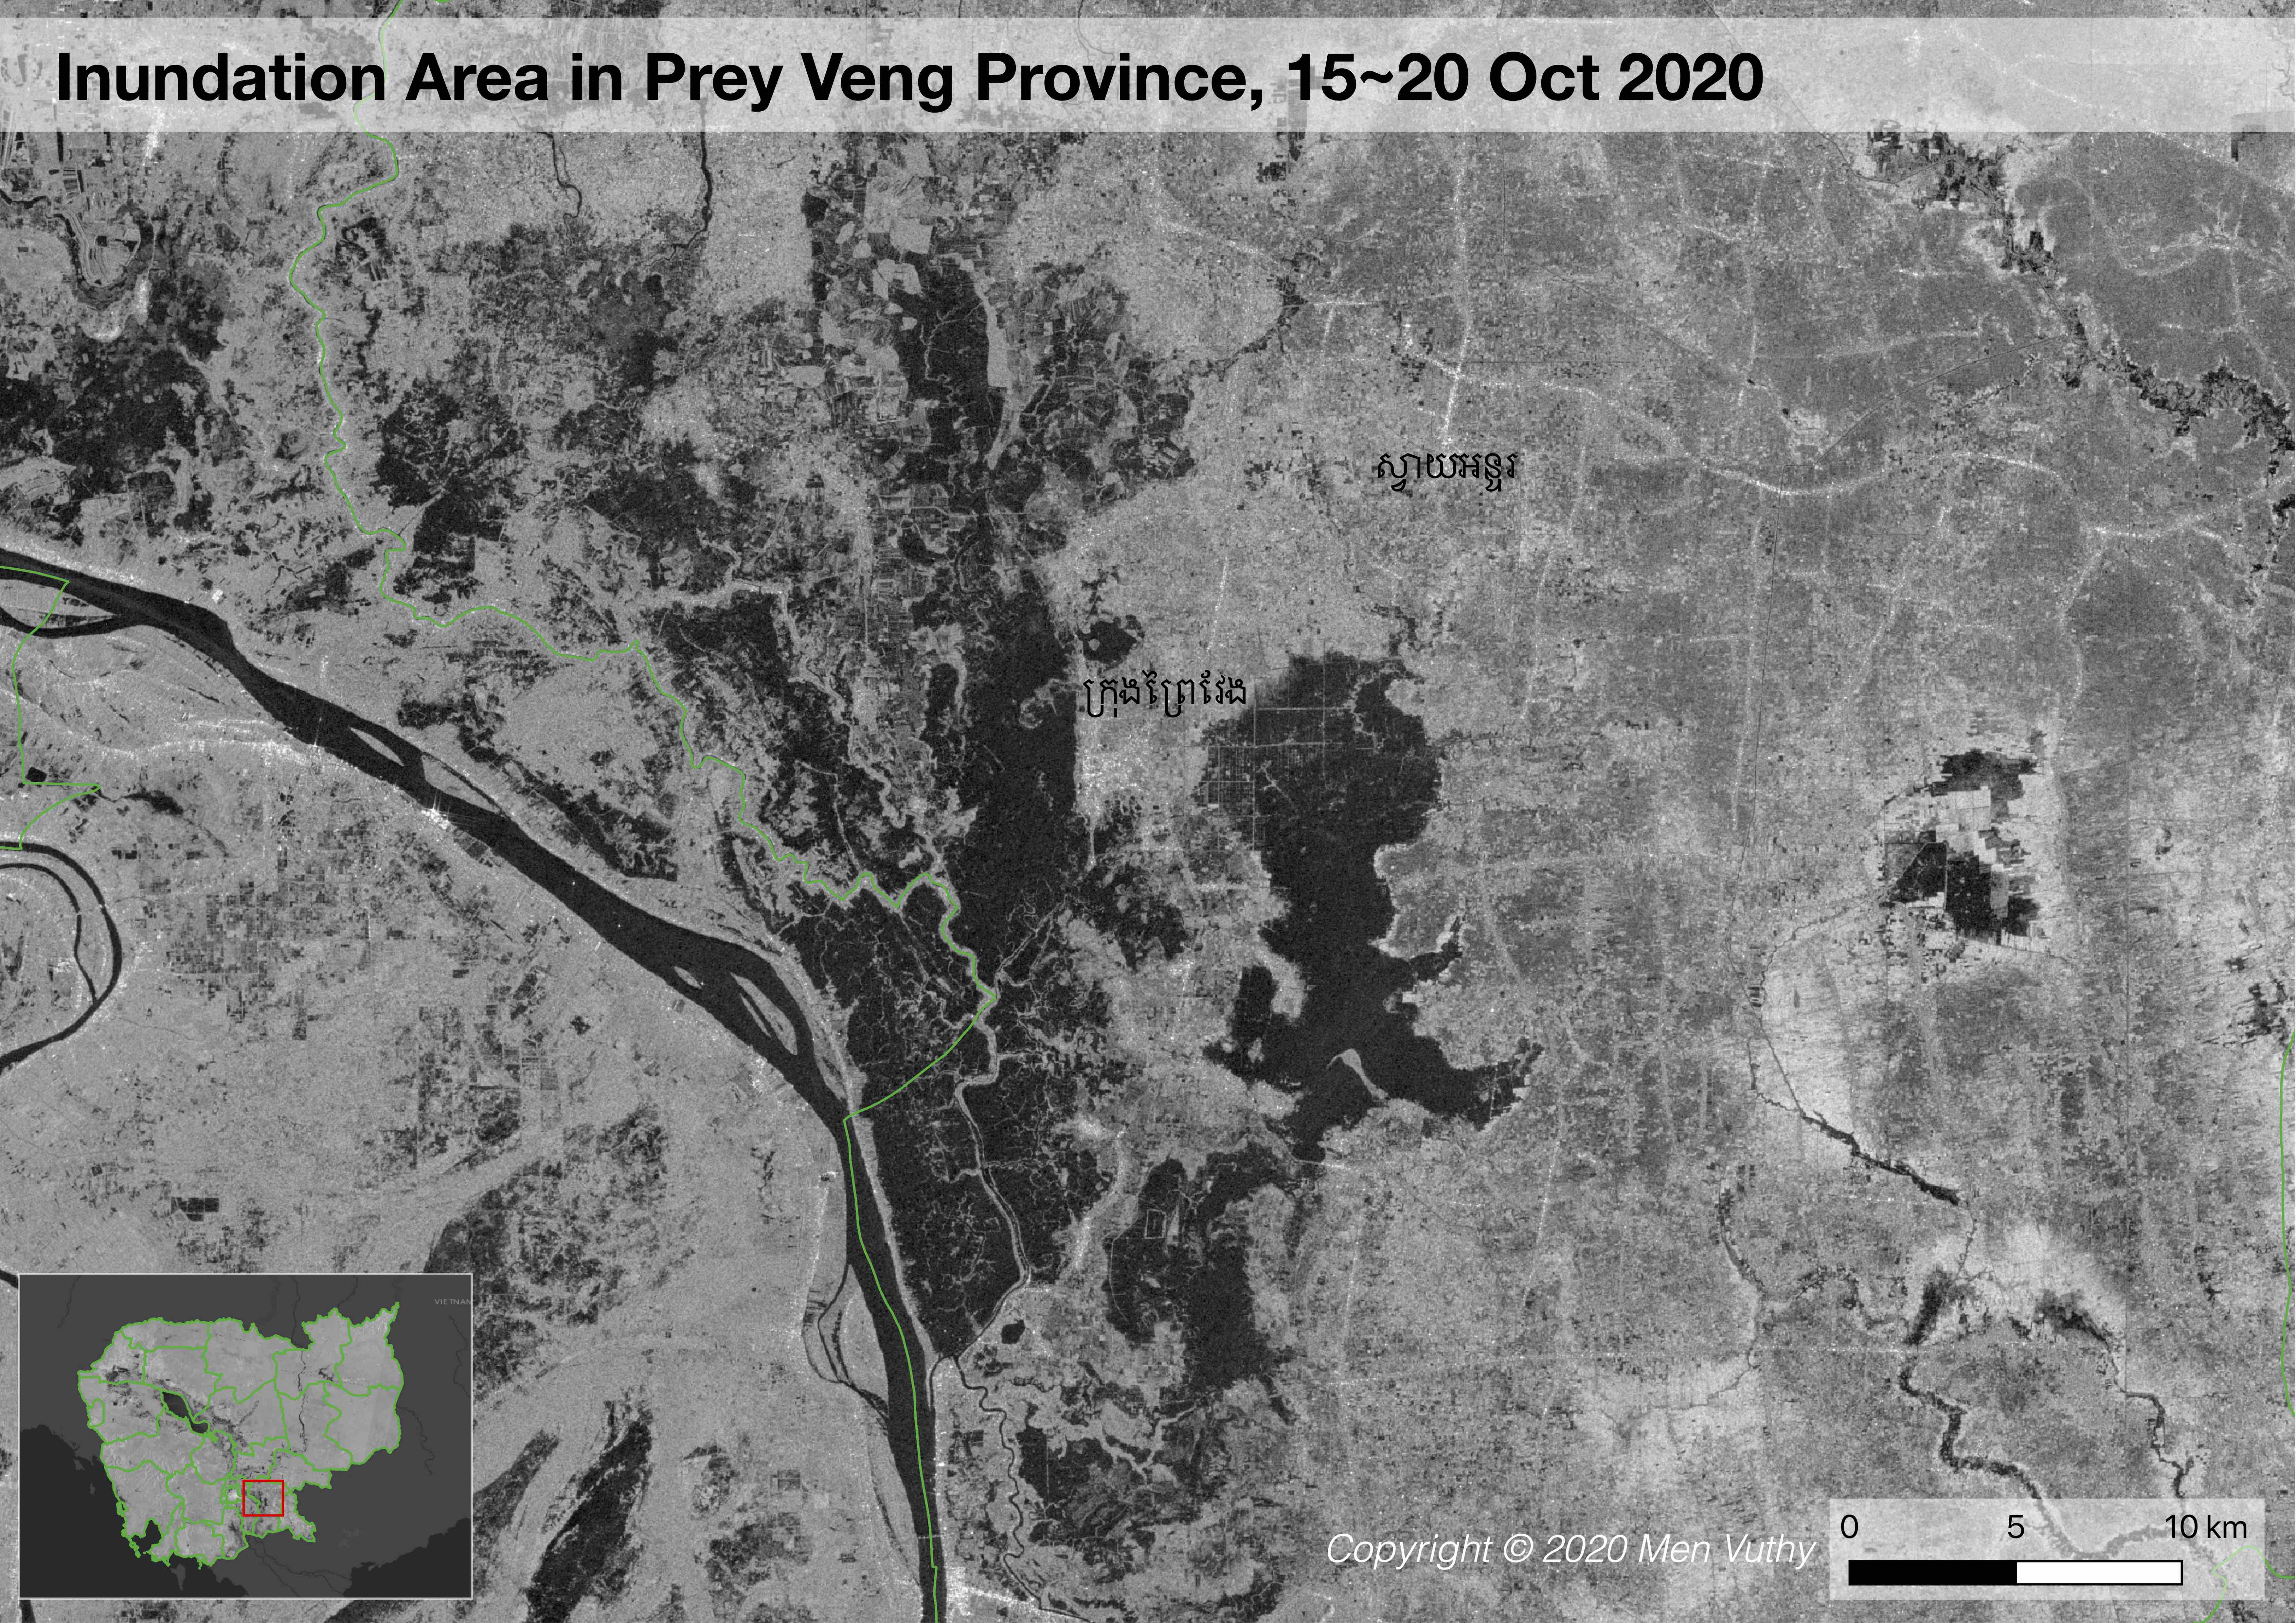
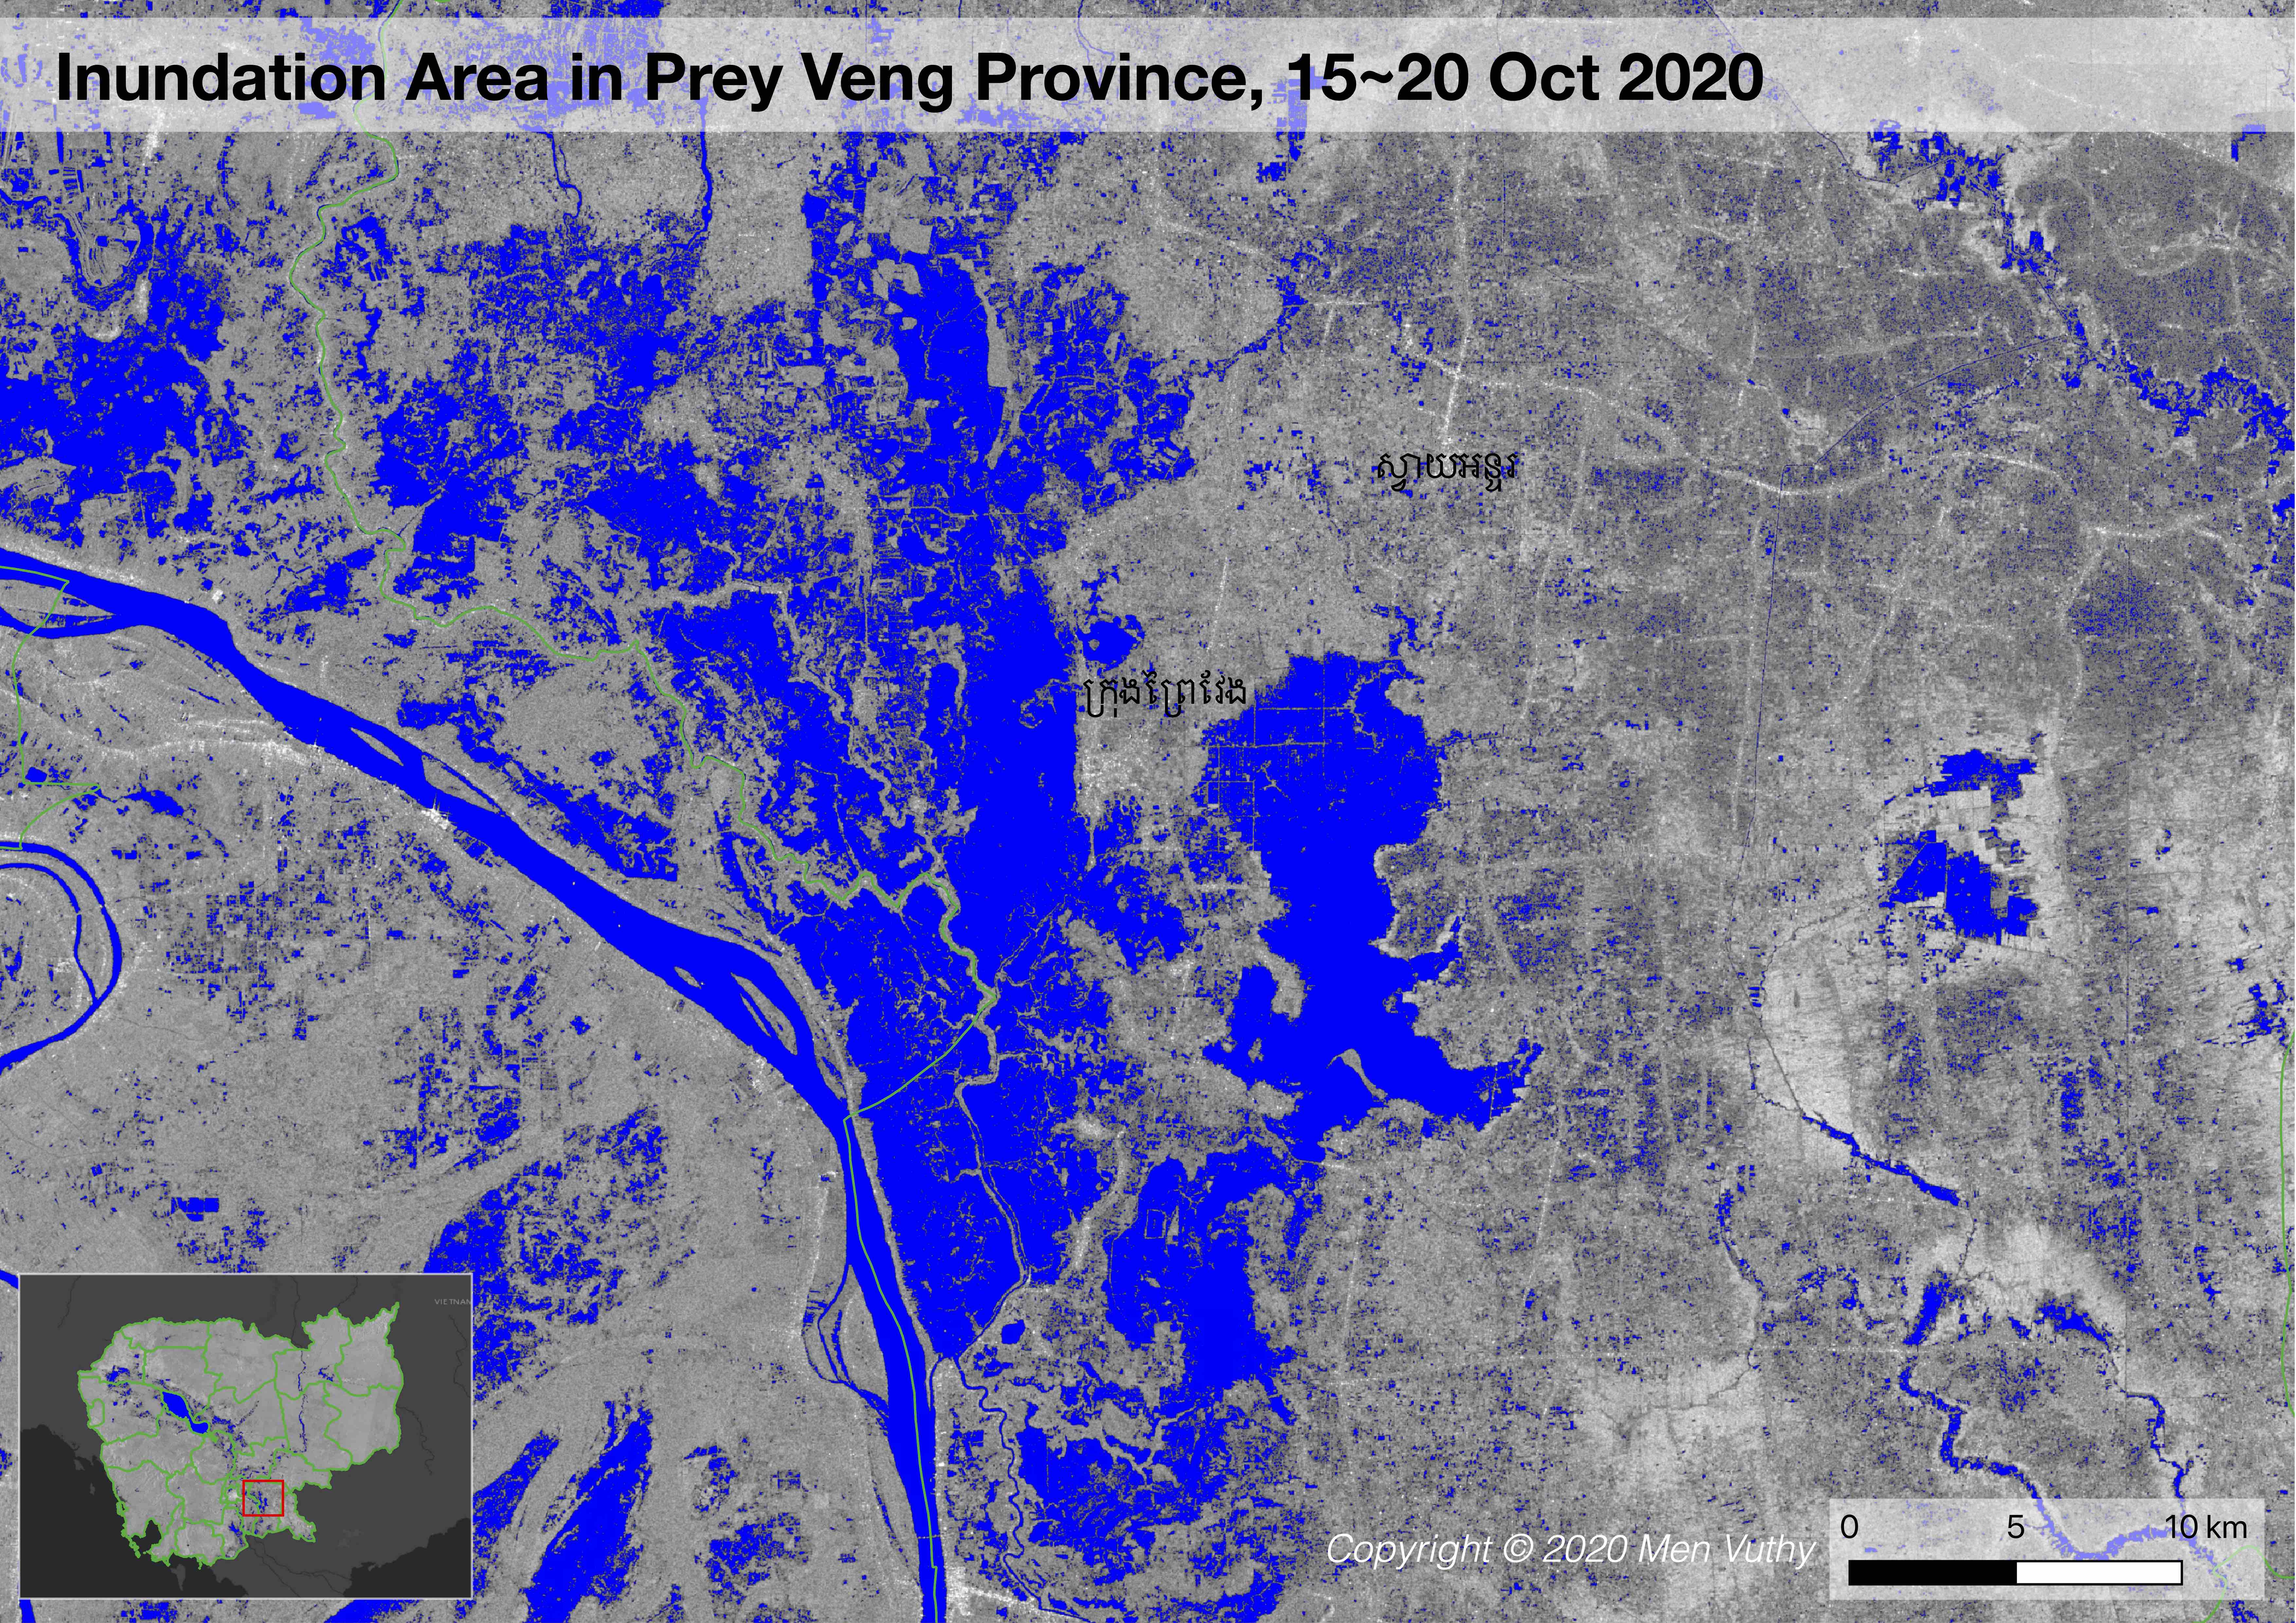
Prey Veng
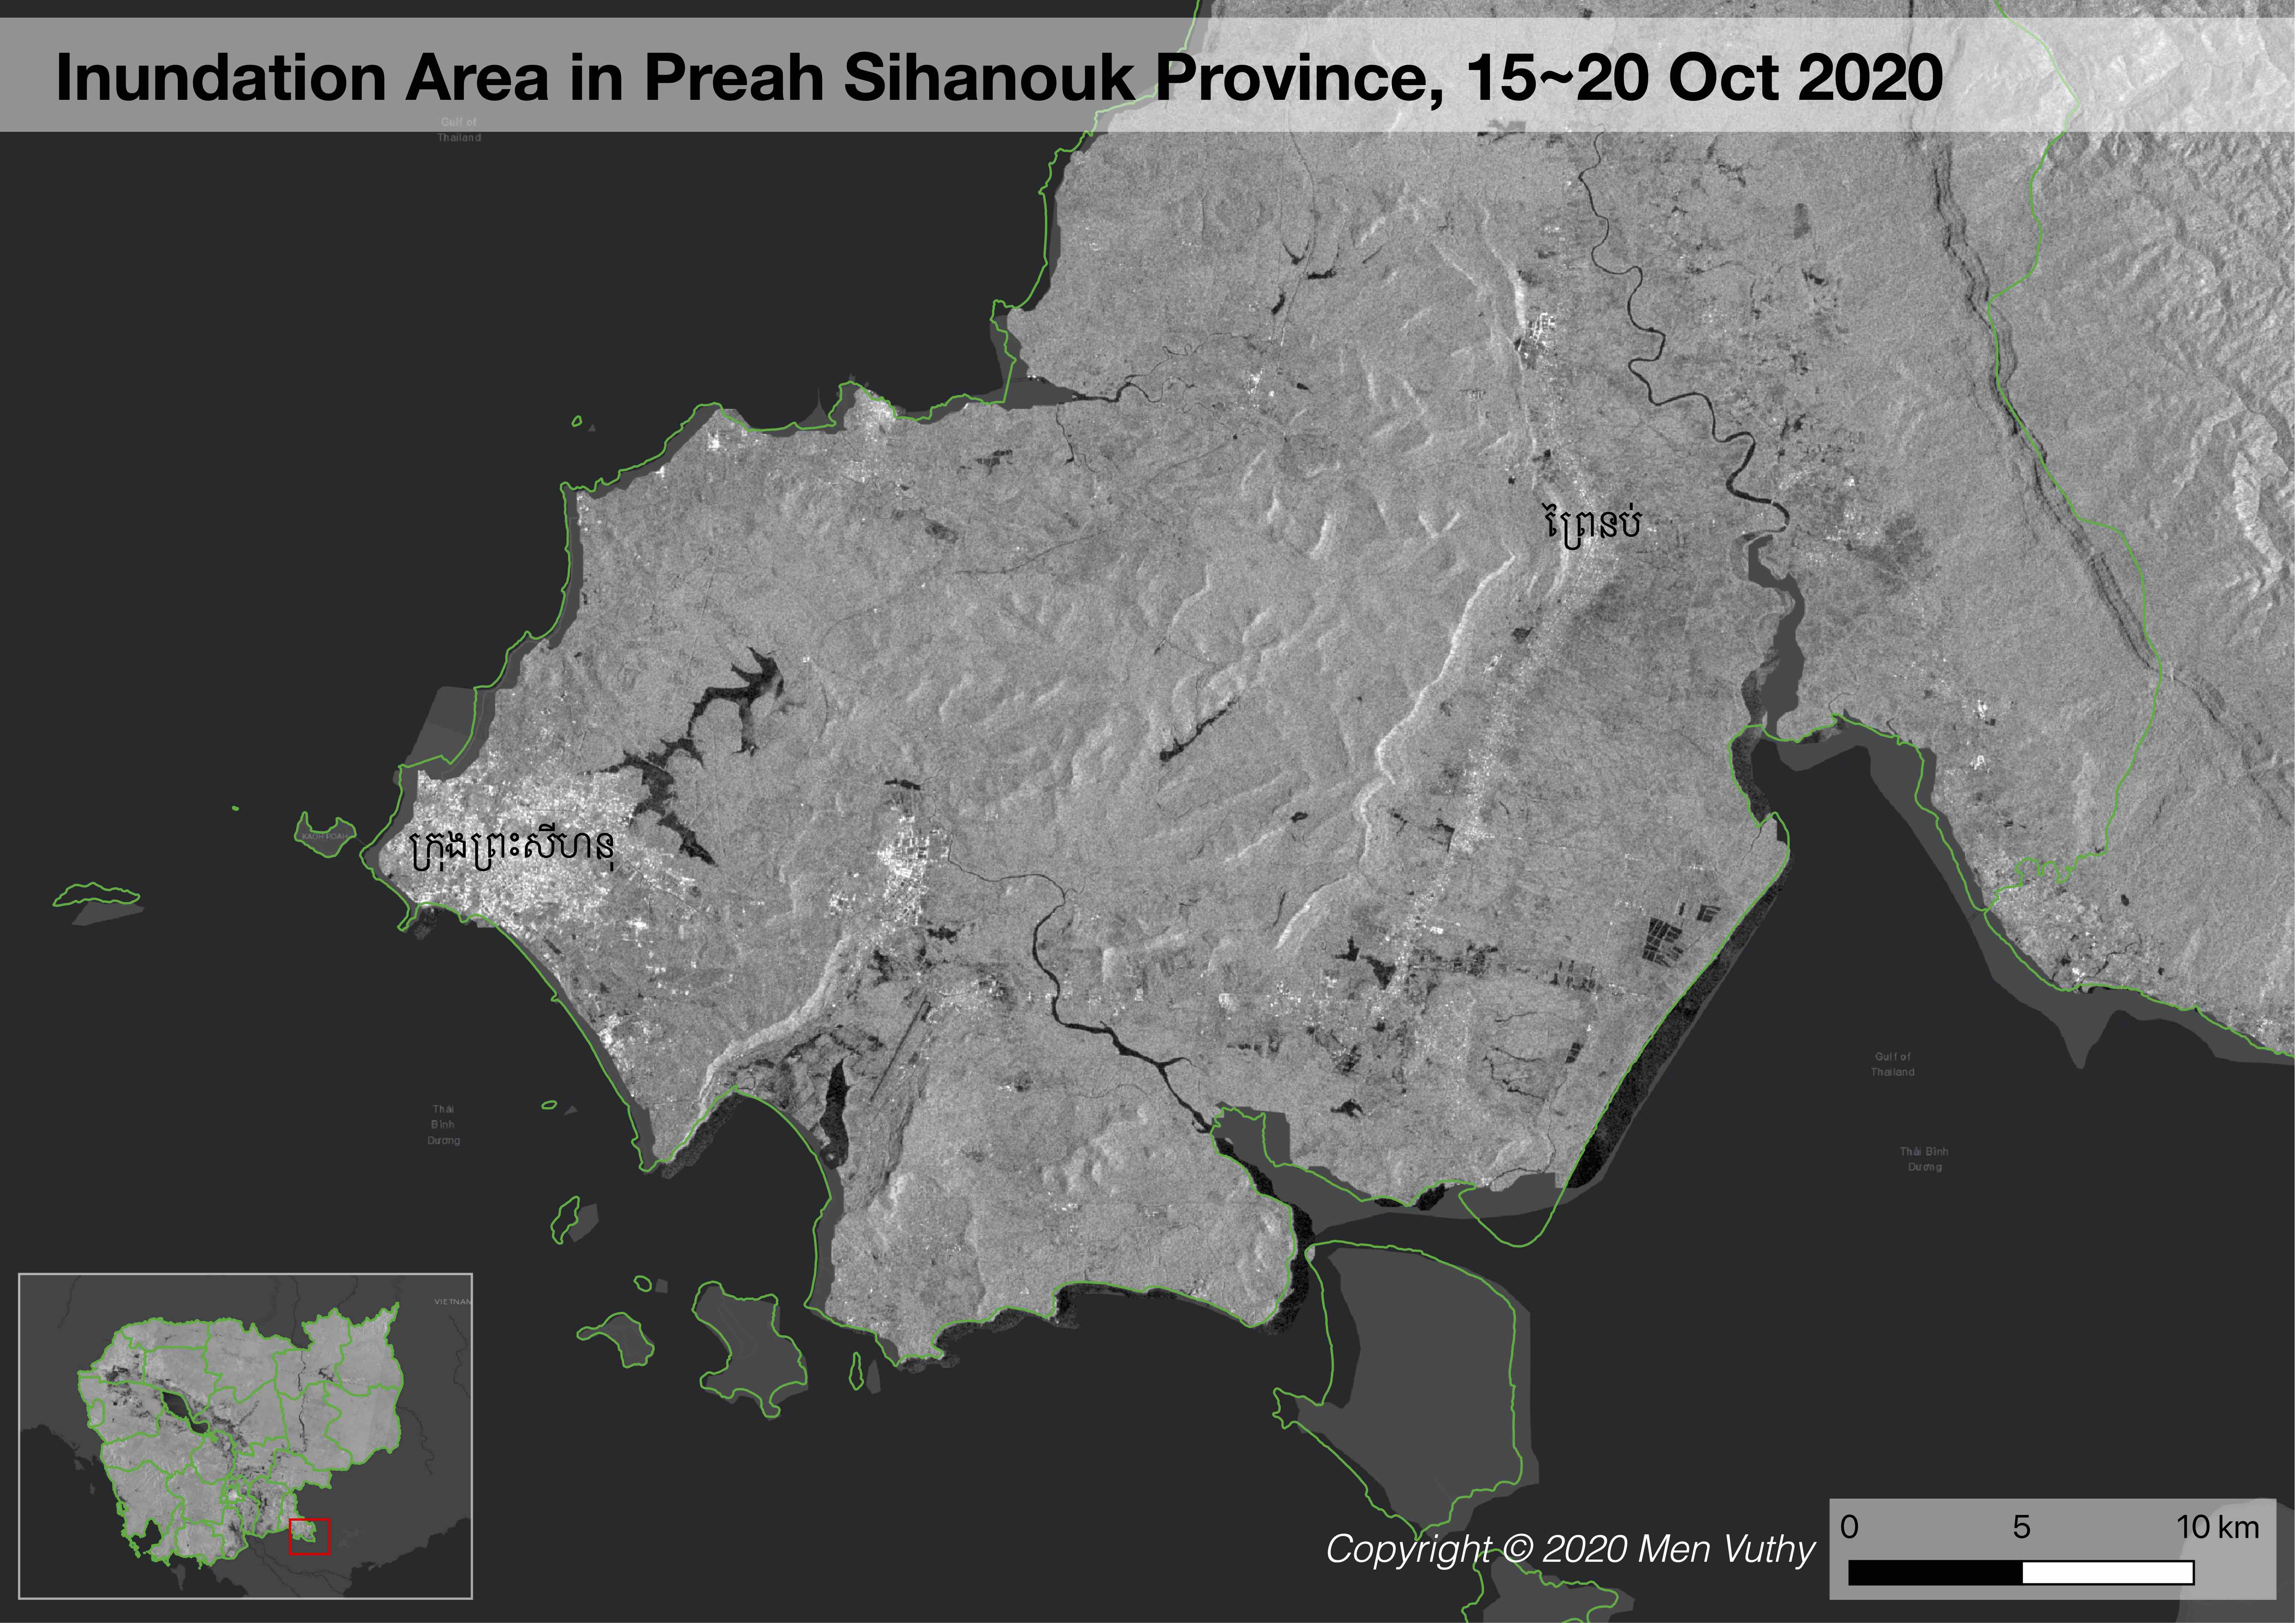
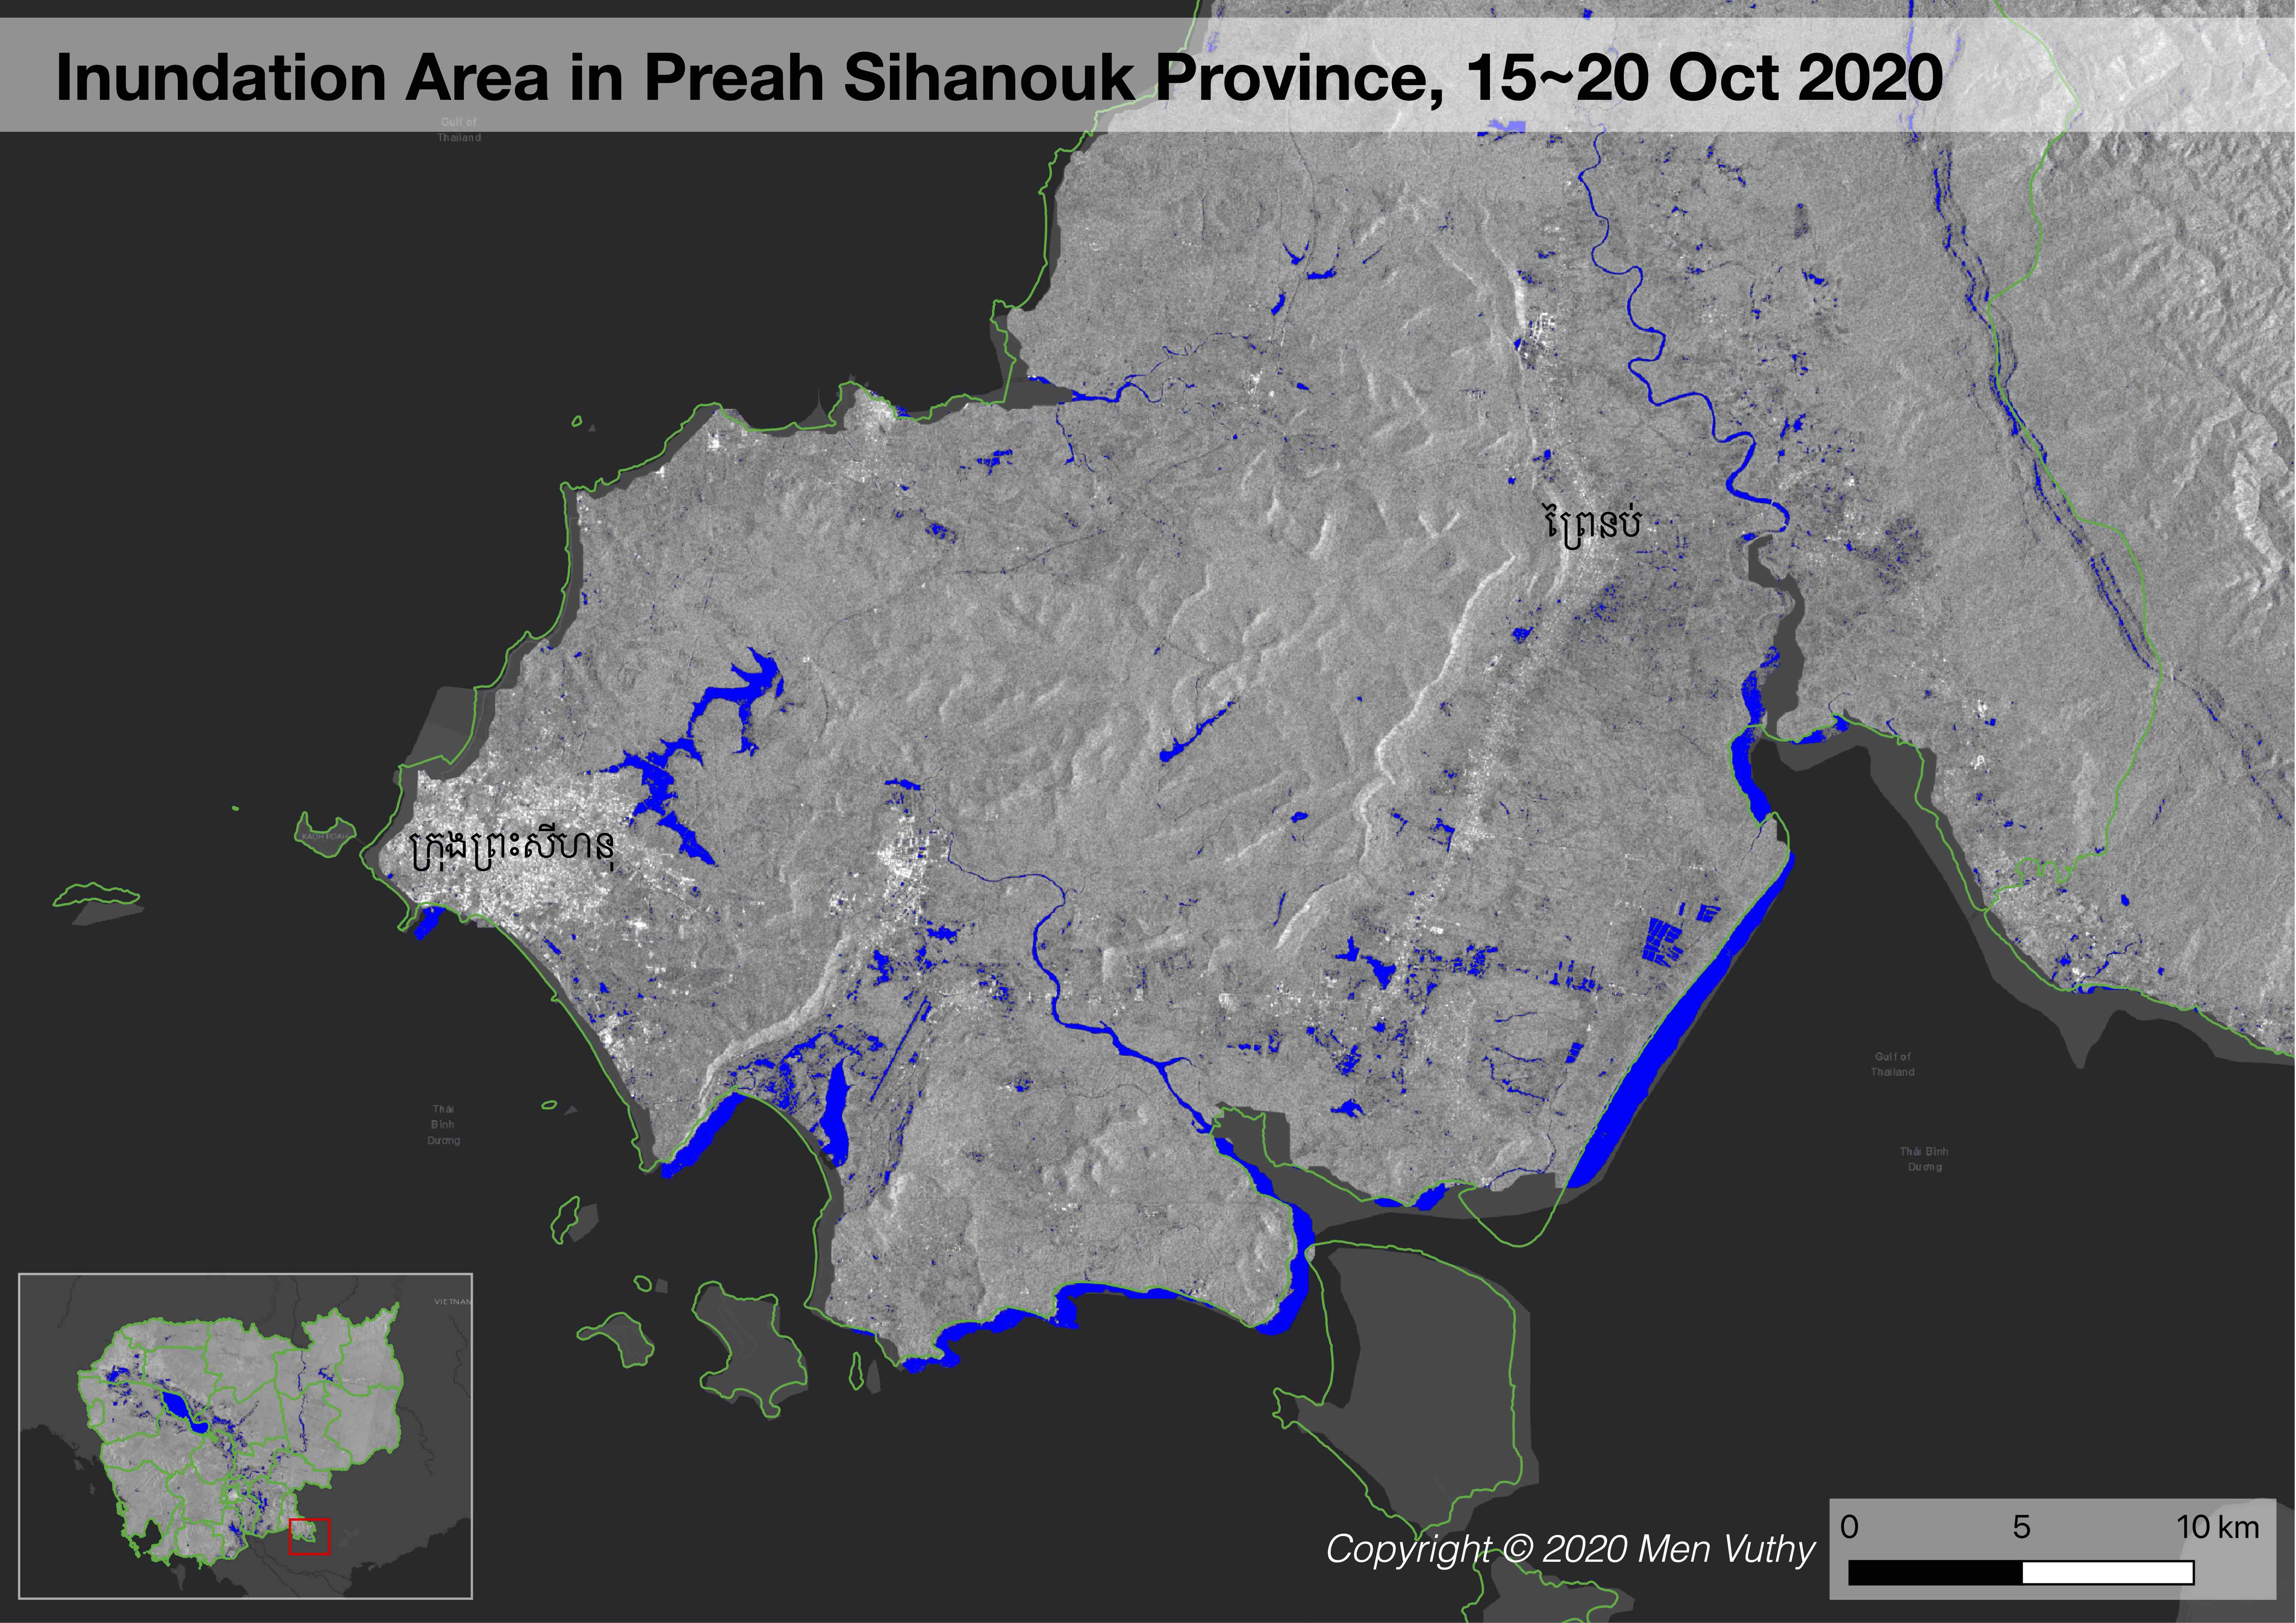
Preah Sihanouk
Methodology
Visualizing the Sentinel-1 SAR images, dectecting waterbody, and extracting it for other analysis can be performed in Google Earth Engine and QGIS by using EE Python API. Therefore, it is important to equip with some background on programming language and QGIS application. Below, I will instruct a few steps on how to visualize the images, detect waterbody and extract inundation area for other computation and analysis.
1. Visualizing the Sentinel-1 SAR GRD images
The platform to run the script is CodeGEE. Filter the collection of Sentinel-1 SAR GRU images for the VV and VH product from the descending track. Filter the date of interest, and add image layer into the map by clipping only Cambodia boundary. Here I used only VV products to analyze the waterbody. VH product can also be used; however, threshold value for determining the waterbody may be slightly different from VH product.
---
// Load country features from Large Scale International Boundary (LSIB) dataset.
var countries = ee.FeatureCollection('USDOS/LSIB_SIMPLE/2017');
var roi = countries.filter(ee.Filter.eq('country_co', 'CB'));
Map.addLayer(roi,{},'Cambodia')

//Let's centre the map view over our ROI
Map.centerObject(roi, 6);

// Filter the collection for the VV product from the descending track
var collectionVV = ee.ImageCollection('COPERNICUS/S1_GRD')
    .filter(ee.Filter.eq('instrumentMode', 'IW'))
    .filter(ee.Filter.listContains('transmitterReceiverPolarisation', 'VV'))
    .filter(ee.Filter.eq('orbitProperties_pass', 'DESCENDING'))
    .filterBounds(roi)
    .select(['VV'])
    .median();

// Filter the collection for the VH product from the descending track
var collectionVH = ee.ImageCollection('COPERNICUS/S1_GRD')
    .filter(ee.Filter.eq('instrumentMode', 'IW'))
    .filter(ee.Filter.listContains('transmitterReceiverPolarisation', 'VH'))
    .filter(ee.Filter.eq('orbitProperties_pass', 'DESCENDING'))
    .filterBounds(roi)
    .select(['VH'])
    .median();

// Adding the VV layer to the map at a specific date
var image = ee.Image(collectionVV.filterDate('2020-10-14', '2020-10-20').median());
Map.addLayer(image.clip(roi), {min: -25, max: 5}, 'Image_VV');
---
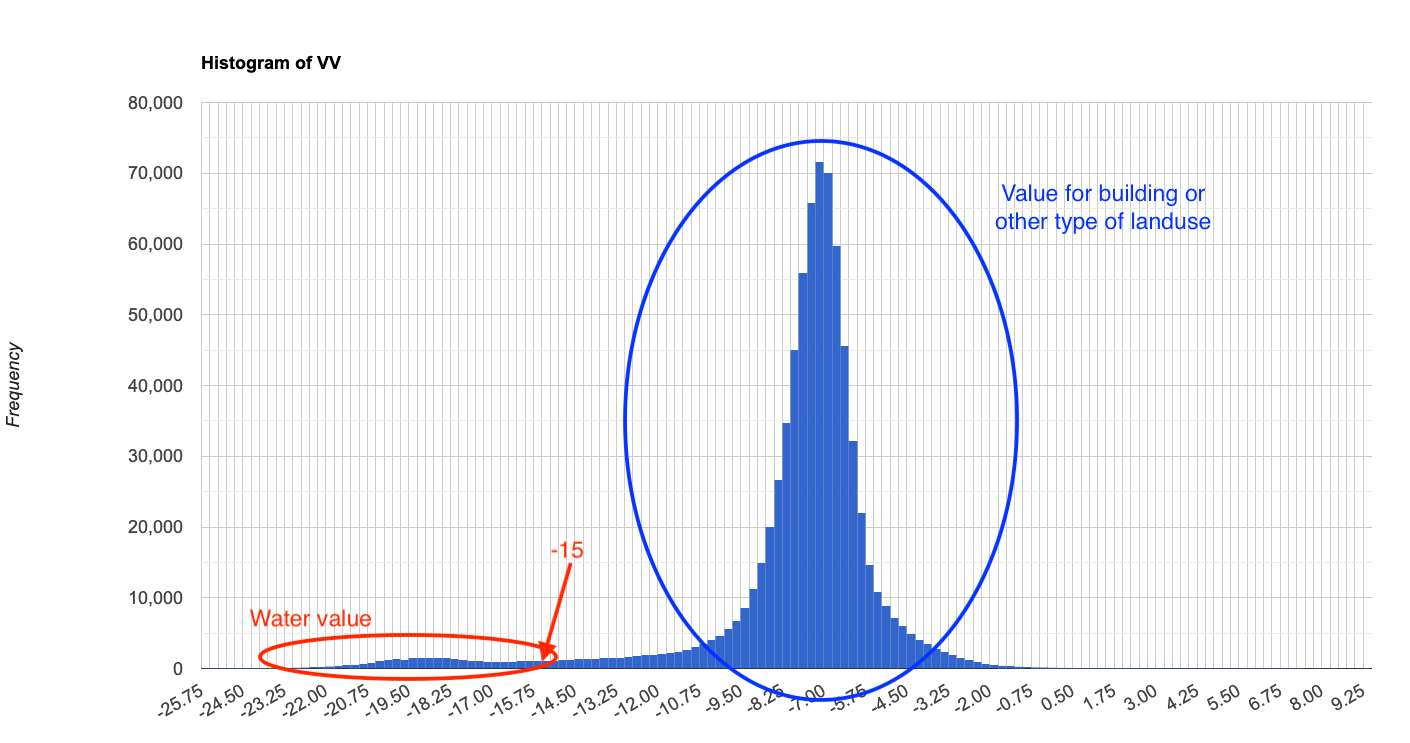
2. Detecting inundation area
The threshold value to differentiate the waterbody from the image is determined from the value of frequency value of VV. The value in the first peak area are generally considered as water value, while other high frequency value represents other types of classification including building, road, bared soil, crops, and forest. In order to compute, the scale should be set based on the size of the region of interest. The smaller the ROI is, the smaller the scale is. In the Cambodia scale, 500 resolution is set due to the fact that the higher resolution might not work due to the limition in GEE cloud when it comes to exporting.
---
// Compute the histogram of the Image
var histogram = image.reduceRegion({
  reducer: ee.Reducer.histogram(255, 2)
      .combine('mean', null, true)
      .combine('variance', null, true),
  geometry: roi,
  scale: 500,
  bestEffort: true
});

// Chart the histogram
print(Chart.image.histogram(image, roi, 500));
---
3. Extract and export the image of inundation area
The image pixels are classified as waterbody where theirs VV values are less than the threshold defined in Step 2, and the classified area can be extracted by masking the non-water area and clipped for Cambodia boundary. The classified image can be then exported as GeoTIFF by setting high maxPixels following the size of the region of interest. By running the code below in GEE, the result of inundation area as GeoTIFF file will be stored in the Google drive.
Notice: The smaller scale, the higher maxPixels.
---
// Chart the histogram
print(Chart.image.histogram(image, roi, 500));

// Classify the Image
var flood = image.lt(-15);
Map.addLayer(flood.mask(flood).clip(roi), {palette: 'blue'}, 'Flood');

Export.image.toDrive({
  image: flood.mask(flood).clip(roi),
  description: 'FloodMap_2',
  scale: 10,
  region: roi,
  maxPixels:4000000000000
});
---
Notice: In order to achieve similar result in QGIS, the script described above shall be converted into EE Python API.
Comment
I hope this instruction can be useful for engineering student or young professional who may need this lesson to work on their project. For the whole workflow, you may contact me directly. If you have any questions or suggestions, please feel free to let me know.
Thank you!
Related websites
Source code is available at: GitHub