Python: Comparison of Reported and Estimated Affected Rice Crop Area
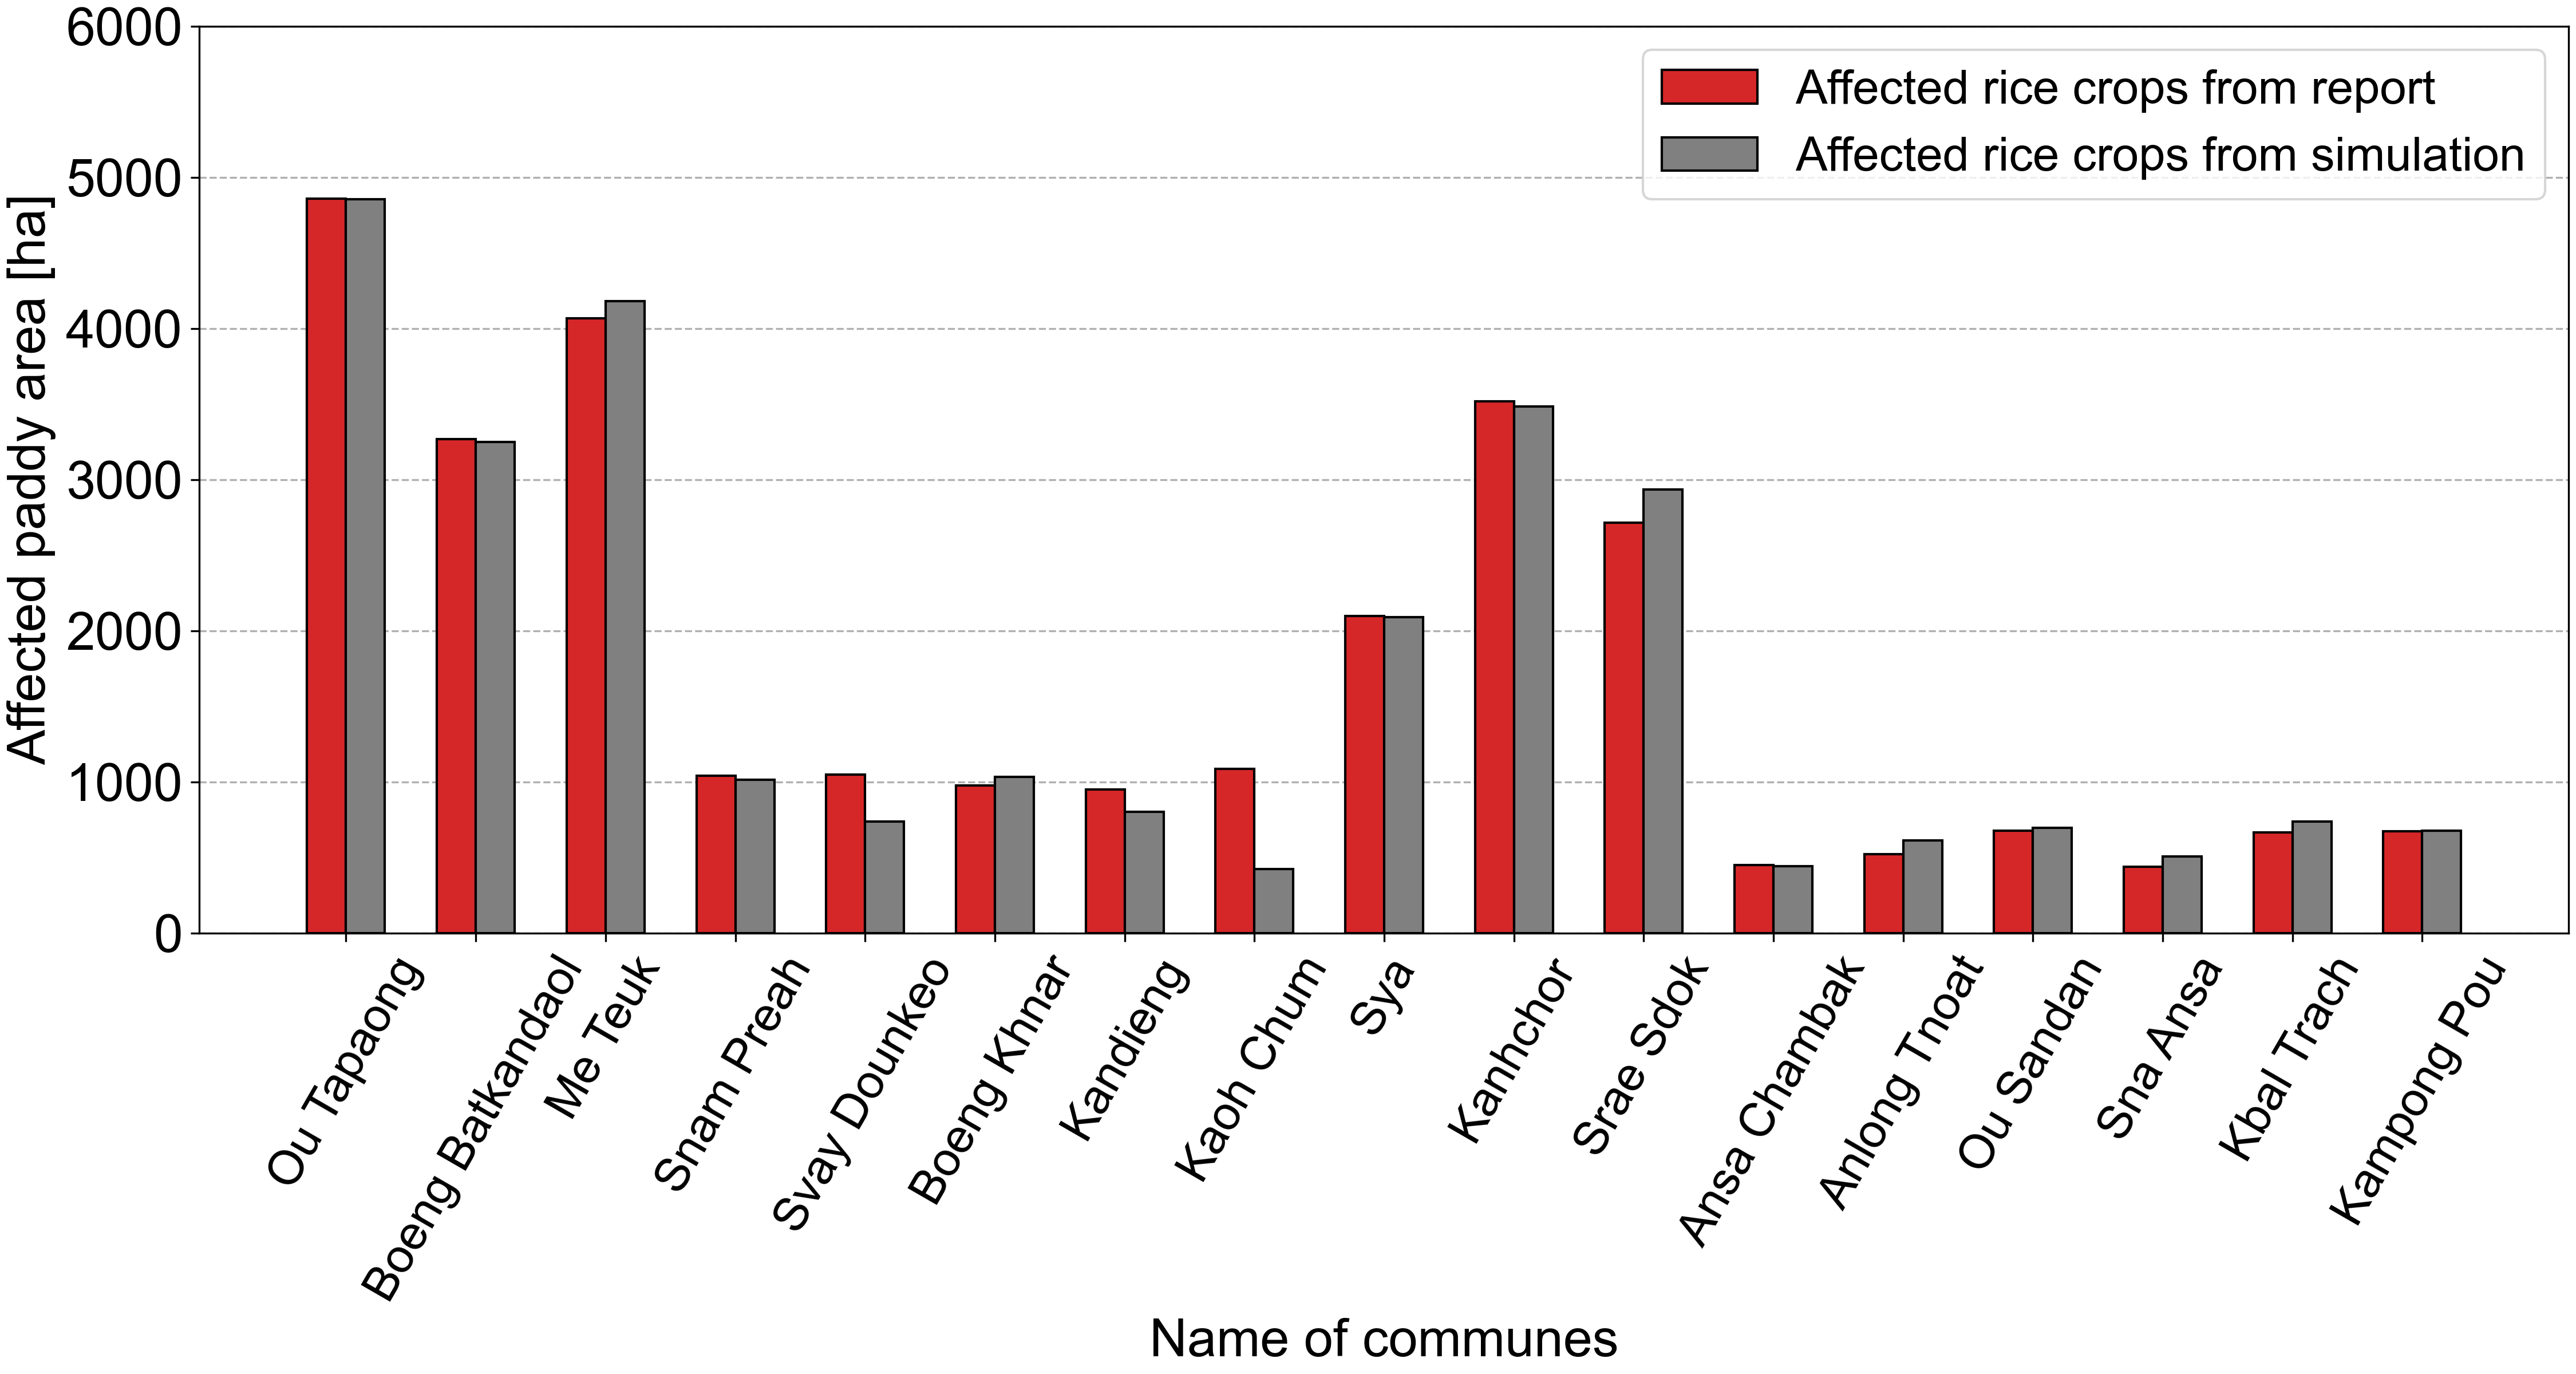
Here I will show how to plot side-by-side stacked line graph to show the comparison of reported and estimated affected rice crop area with the code written i...

Here I will show how to plot side-by-side stacked line graph to show the comparison of reported and estimated affected rice crop area with the code written i...
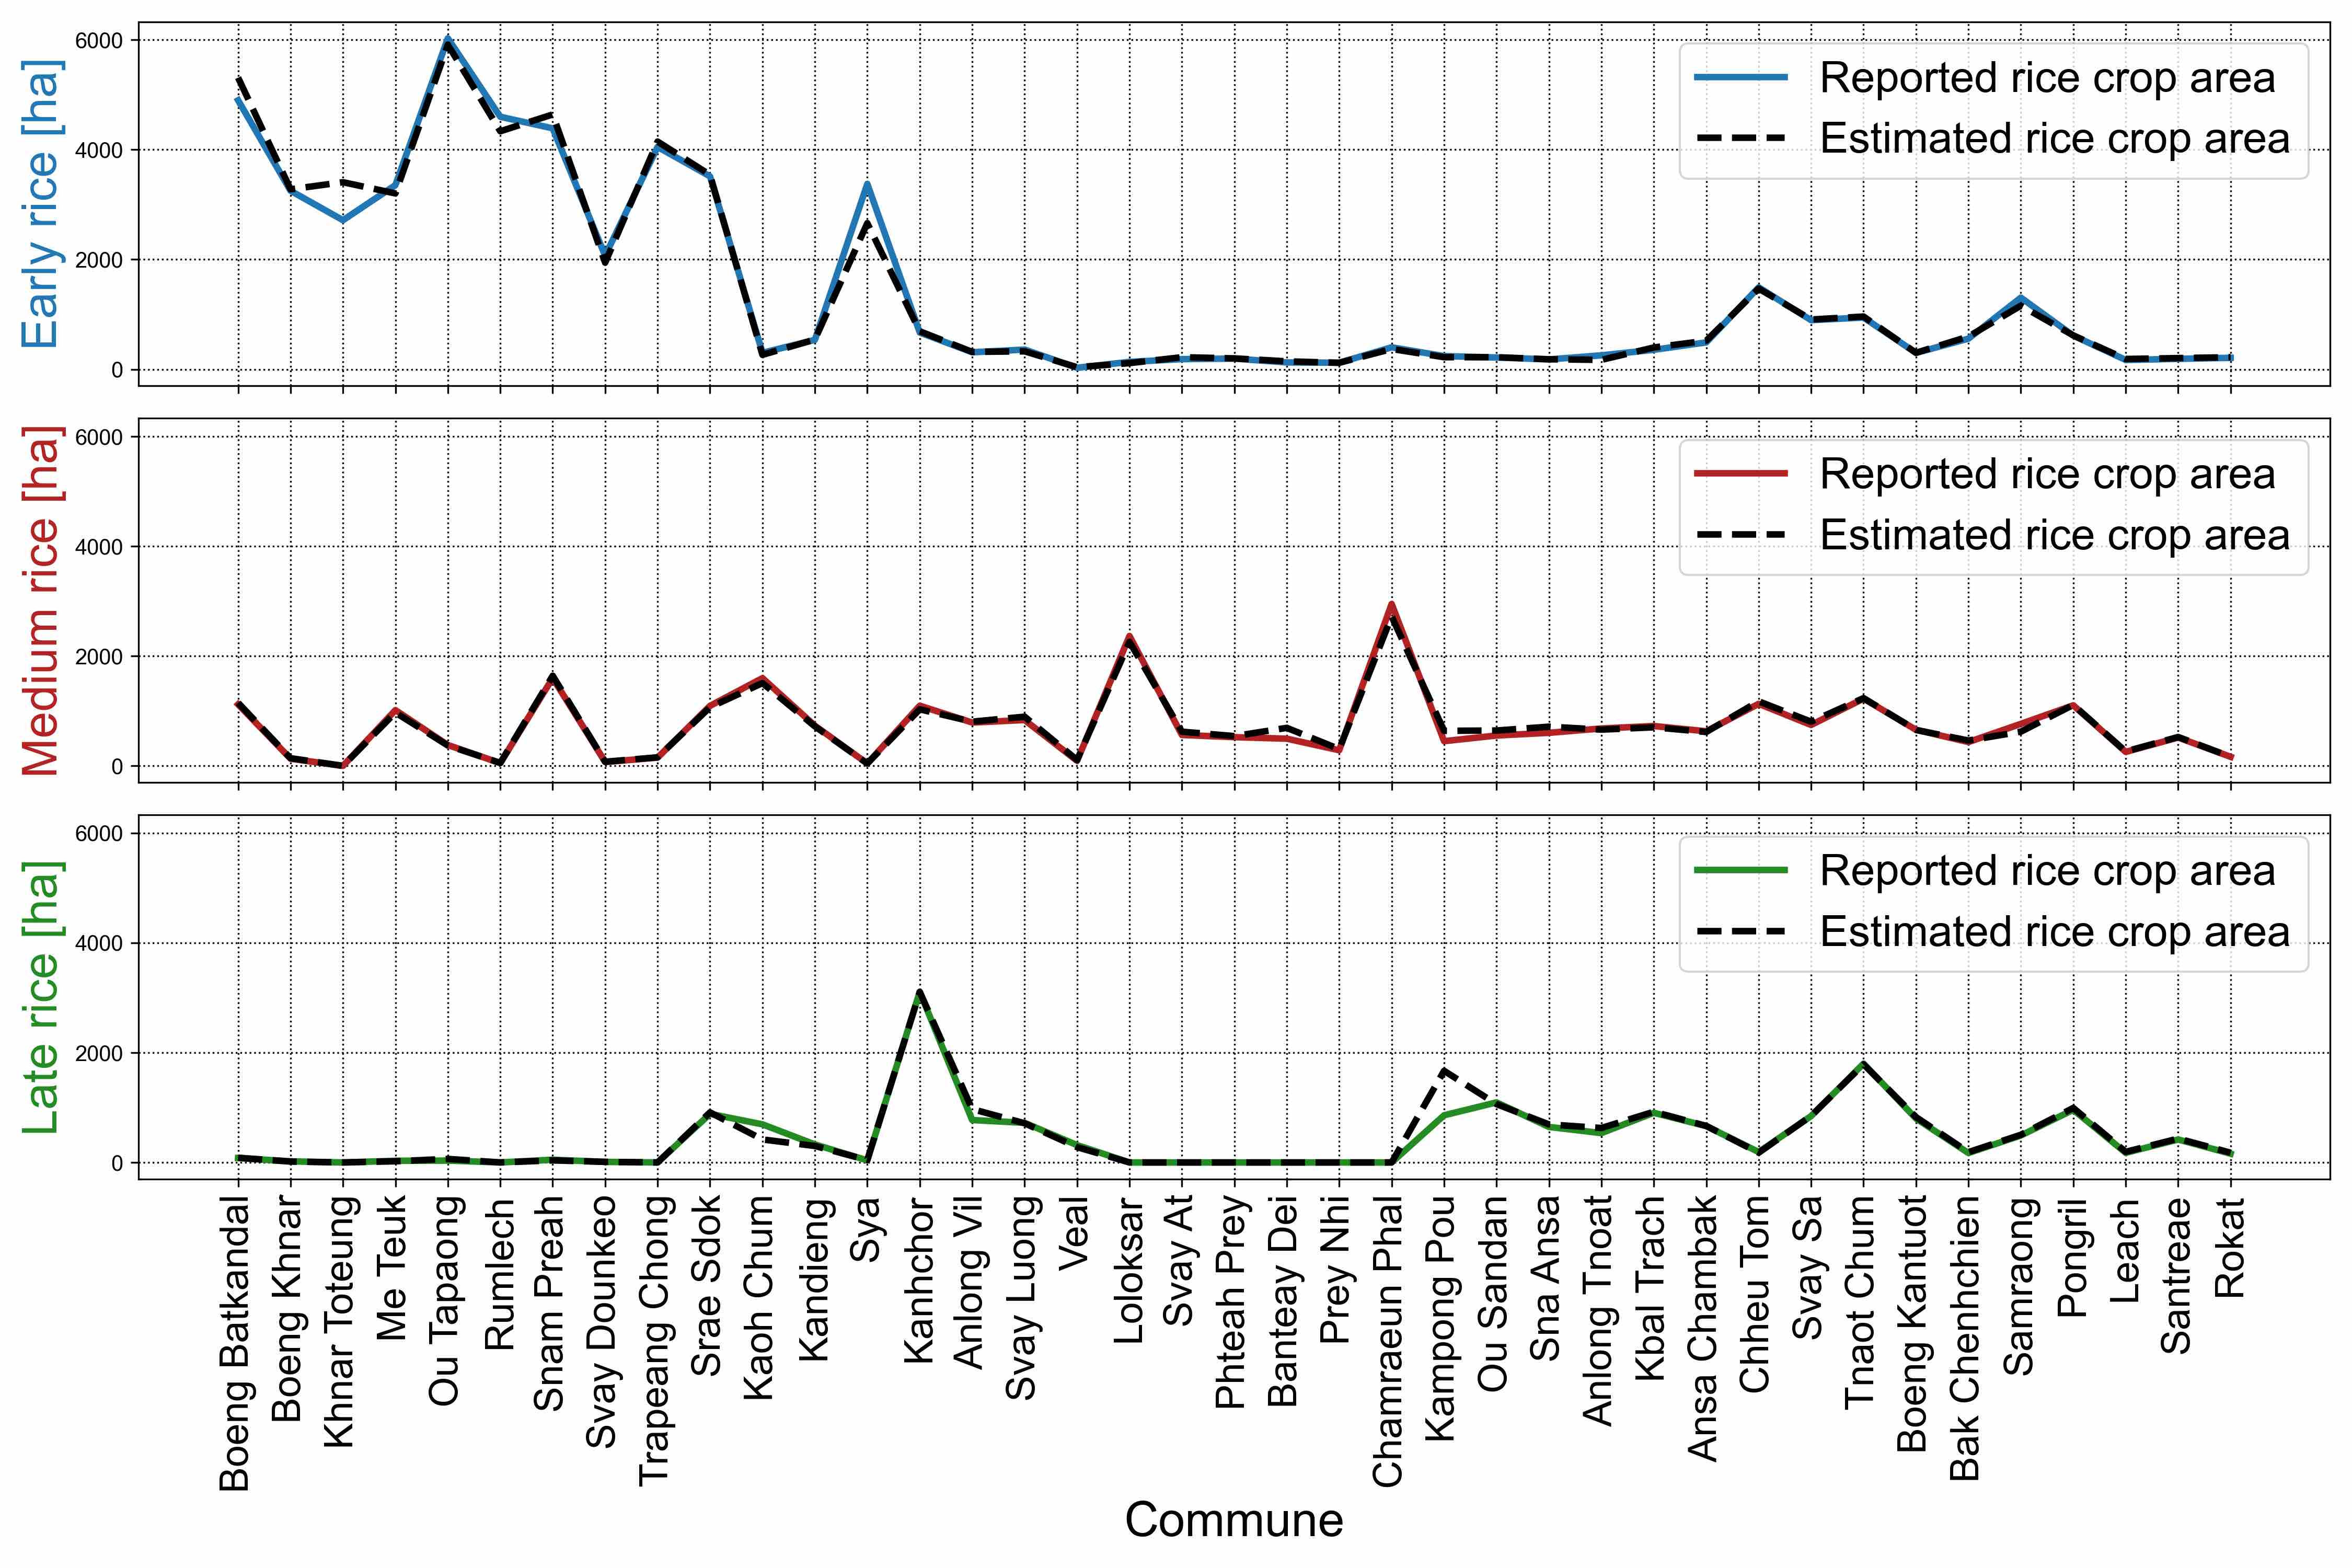
Here I will show how to plot three stacked line graph to show the comparion of reported and estimated rice crop area with the code written in Python Jupiter ...
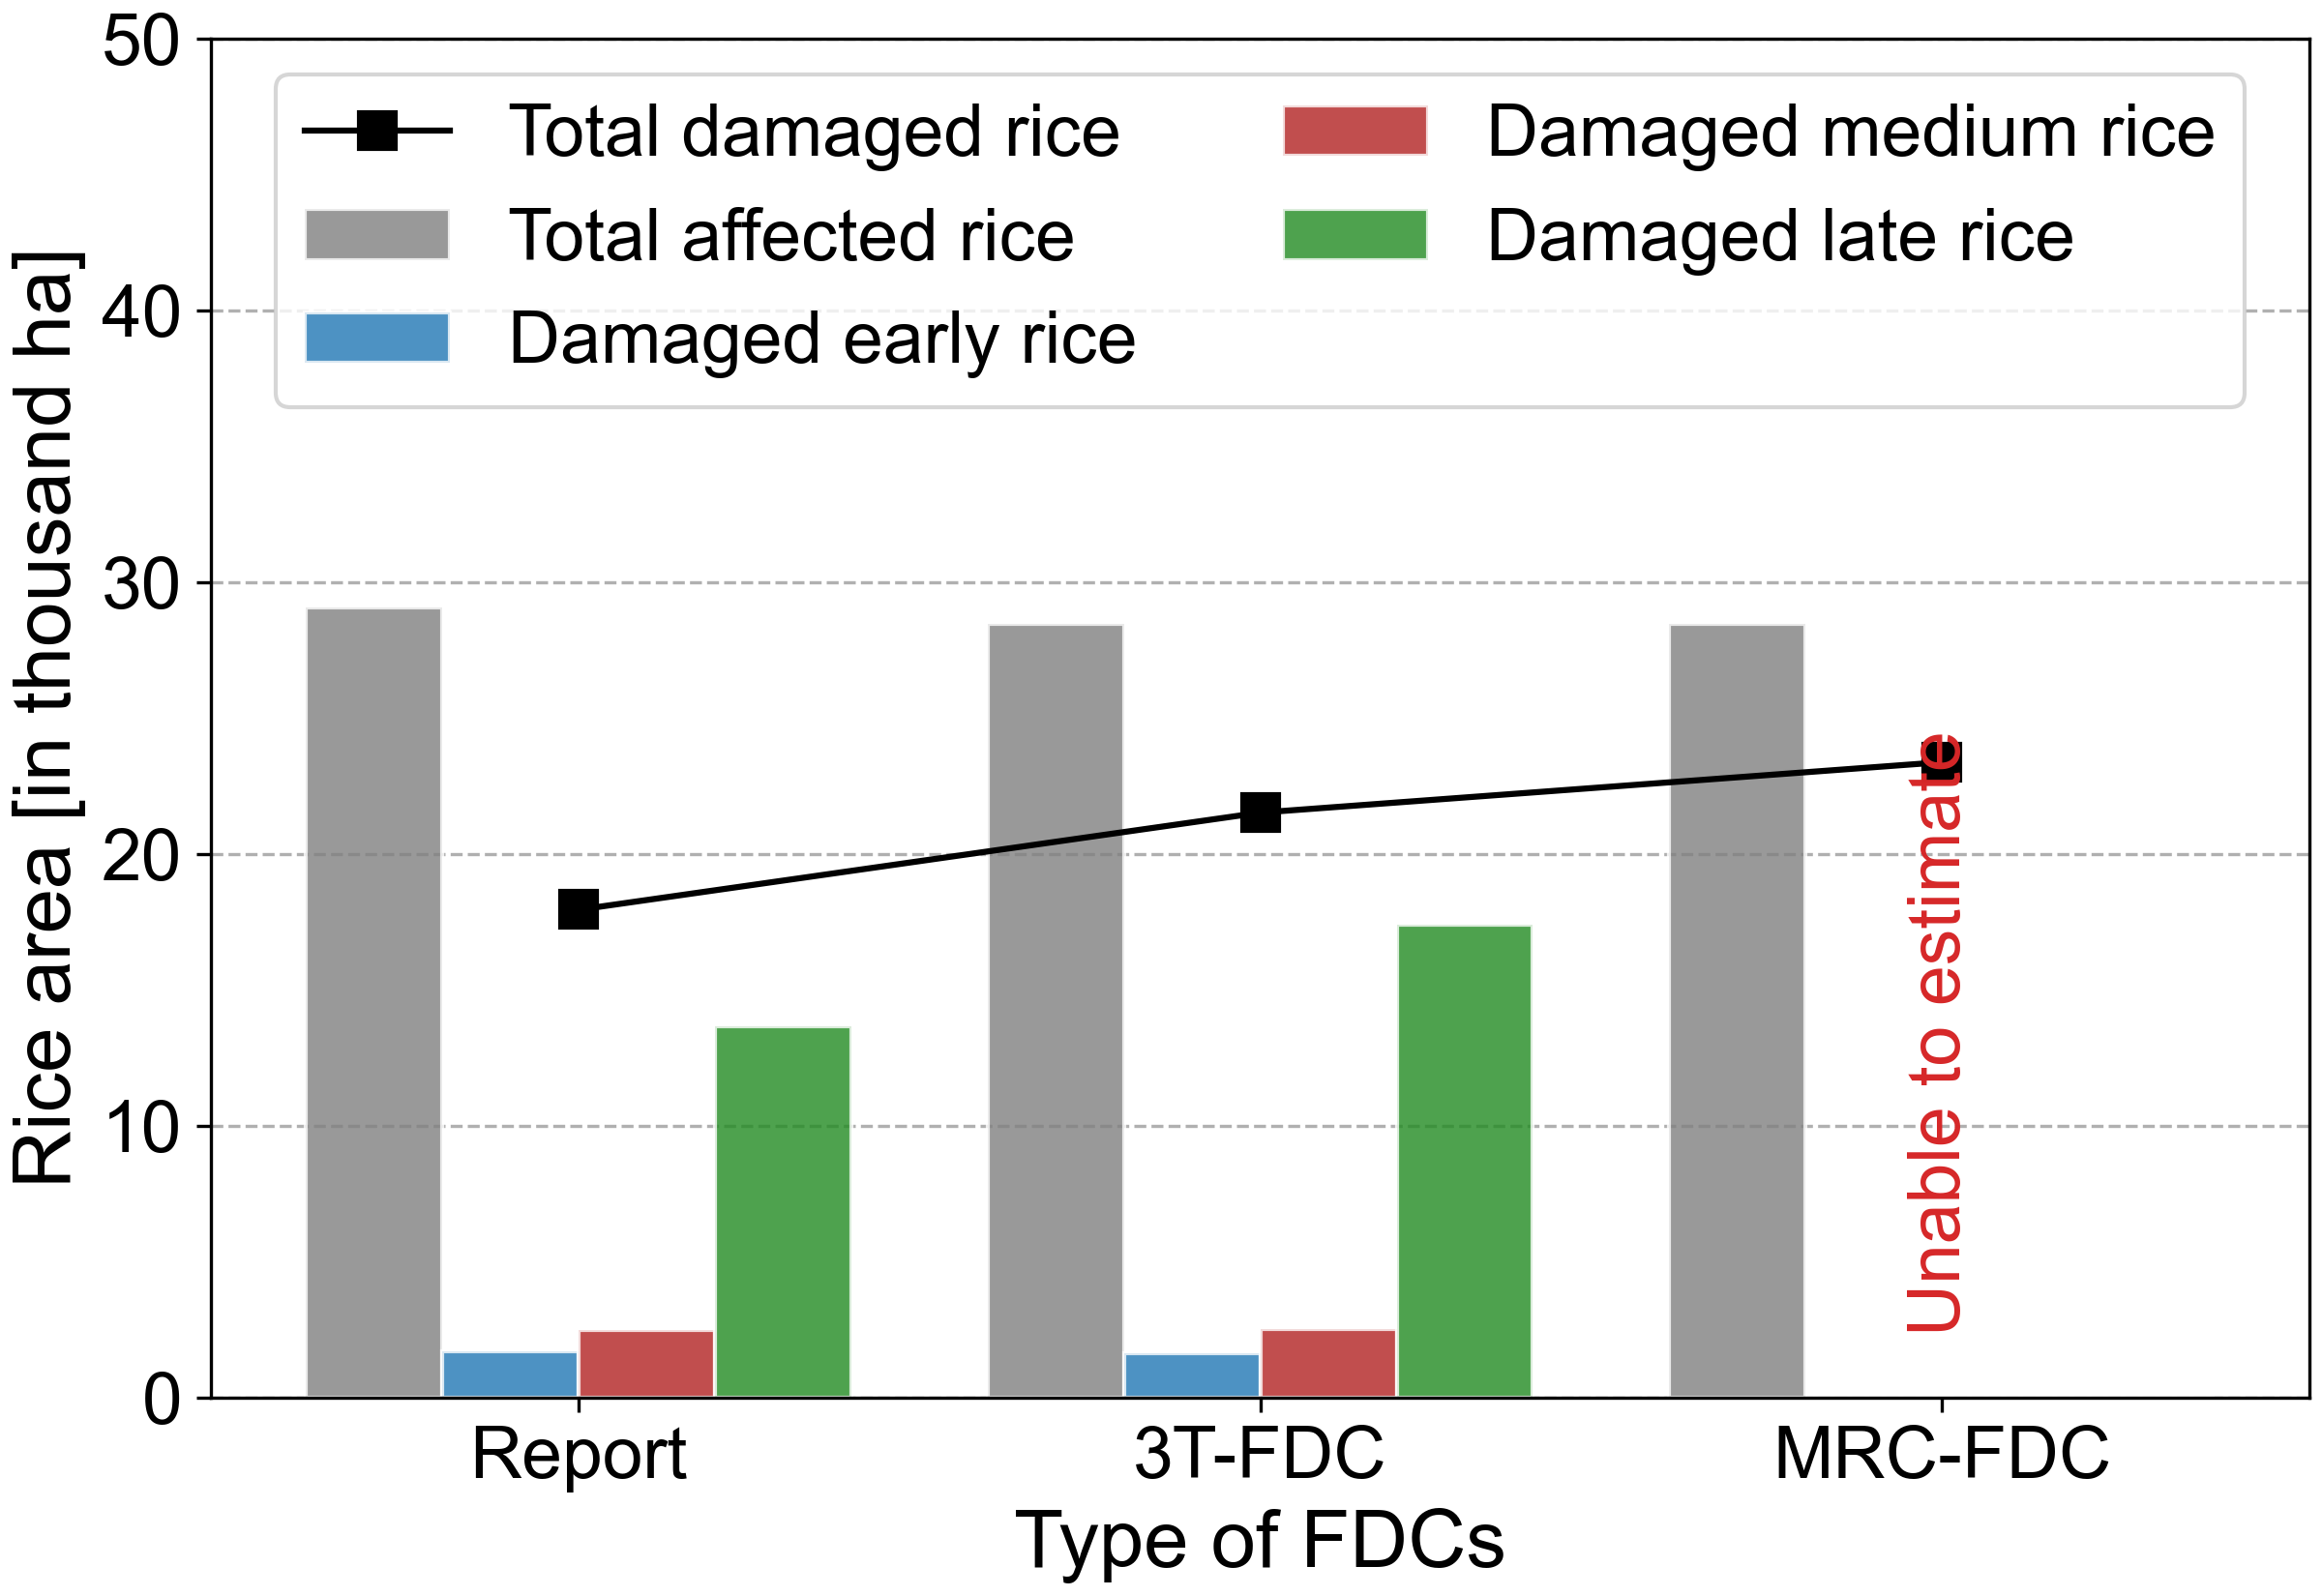
Here I will show how to plot side-by-side bar with line graph to show the comparison of reported and estimated total damaged rice crop with the code written ...
Here I will show how to plot horizontal bar chart to show the number of Covid-19 confirmed cases in Tokyo with the code written in Python Jupiter Notebook.
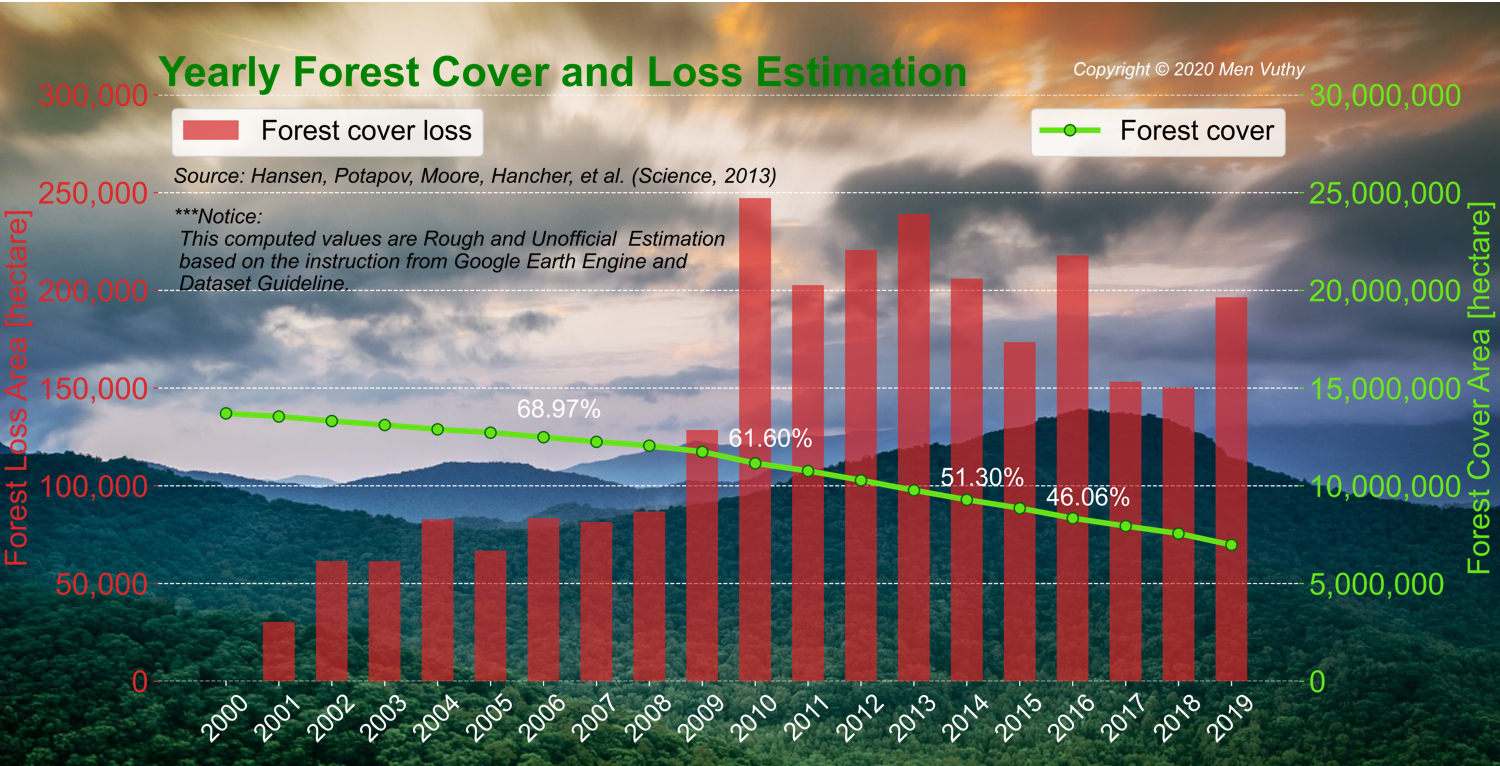
Here I will show how to plot bar chart with line graph to show the yearly forest loss in Cambodia with the code written in Python Jupiter Notebook.
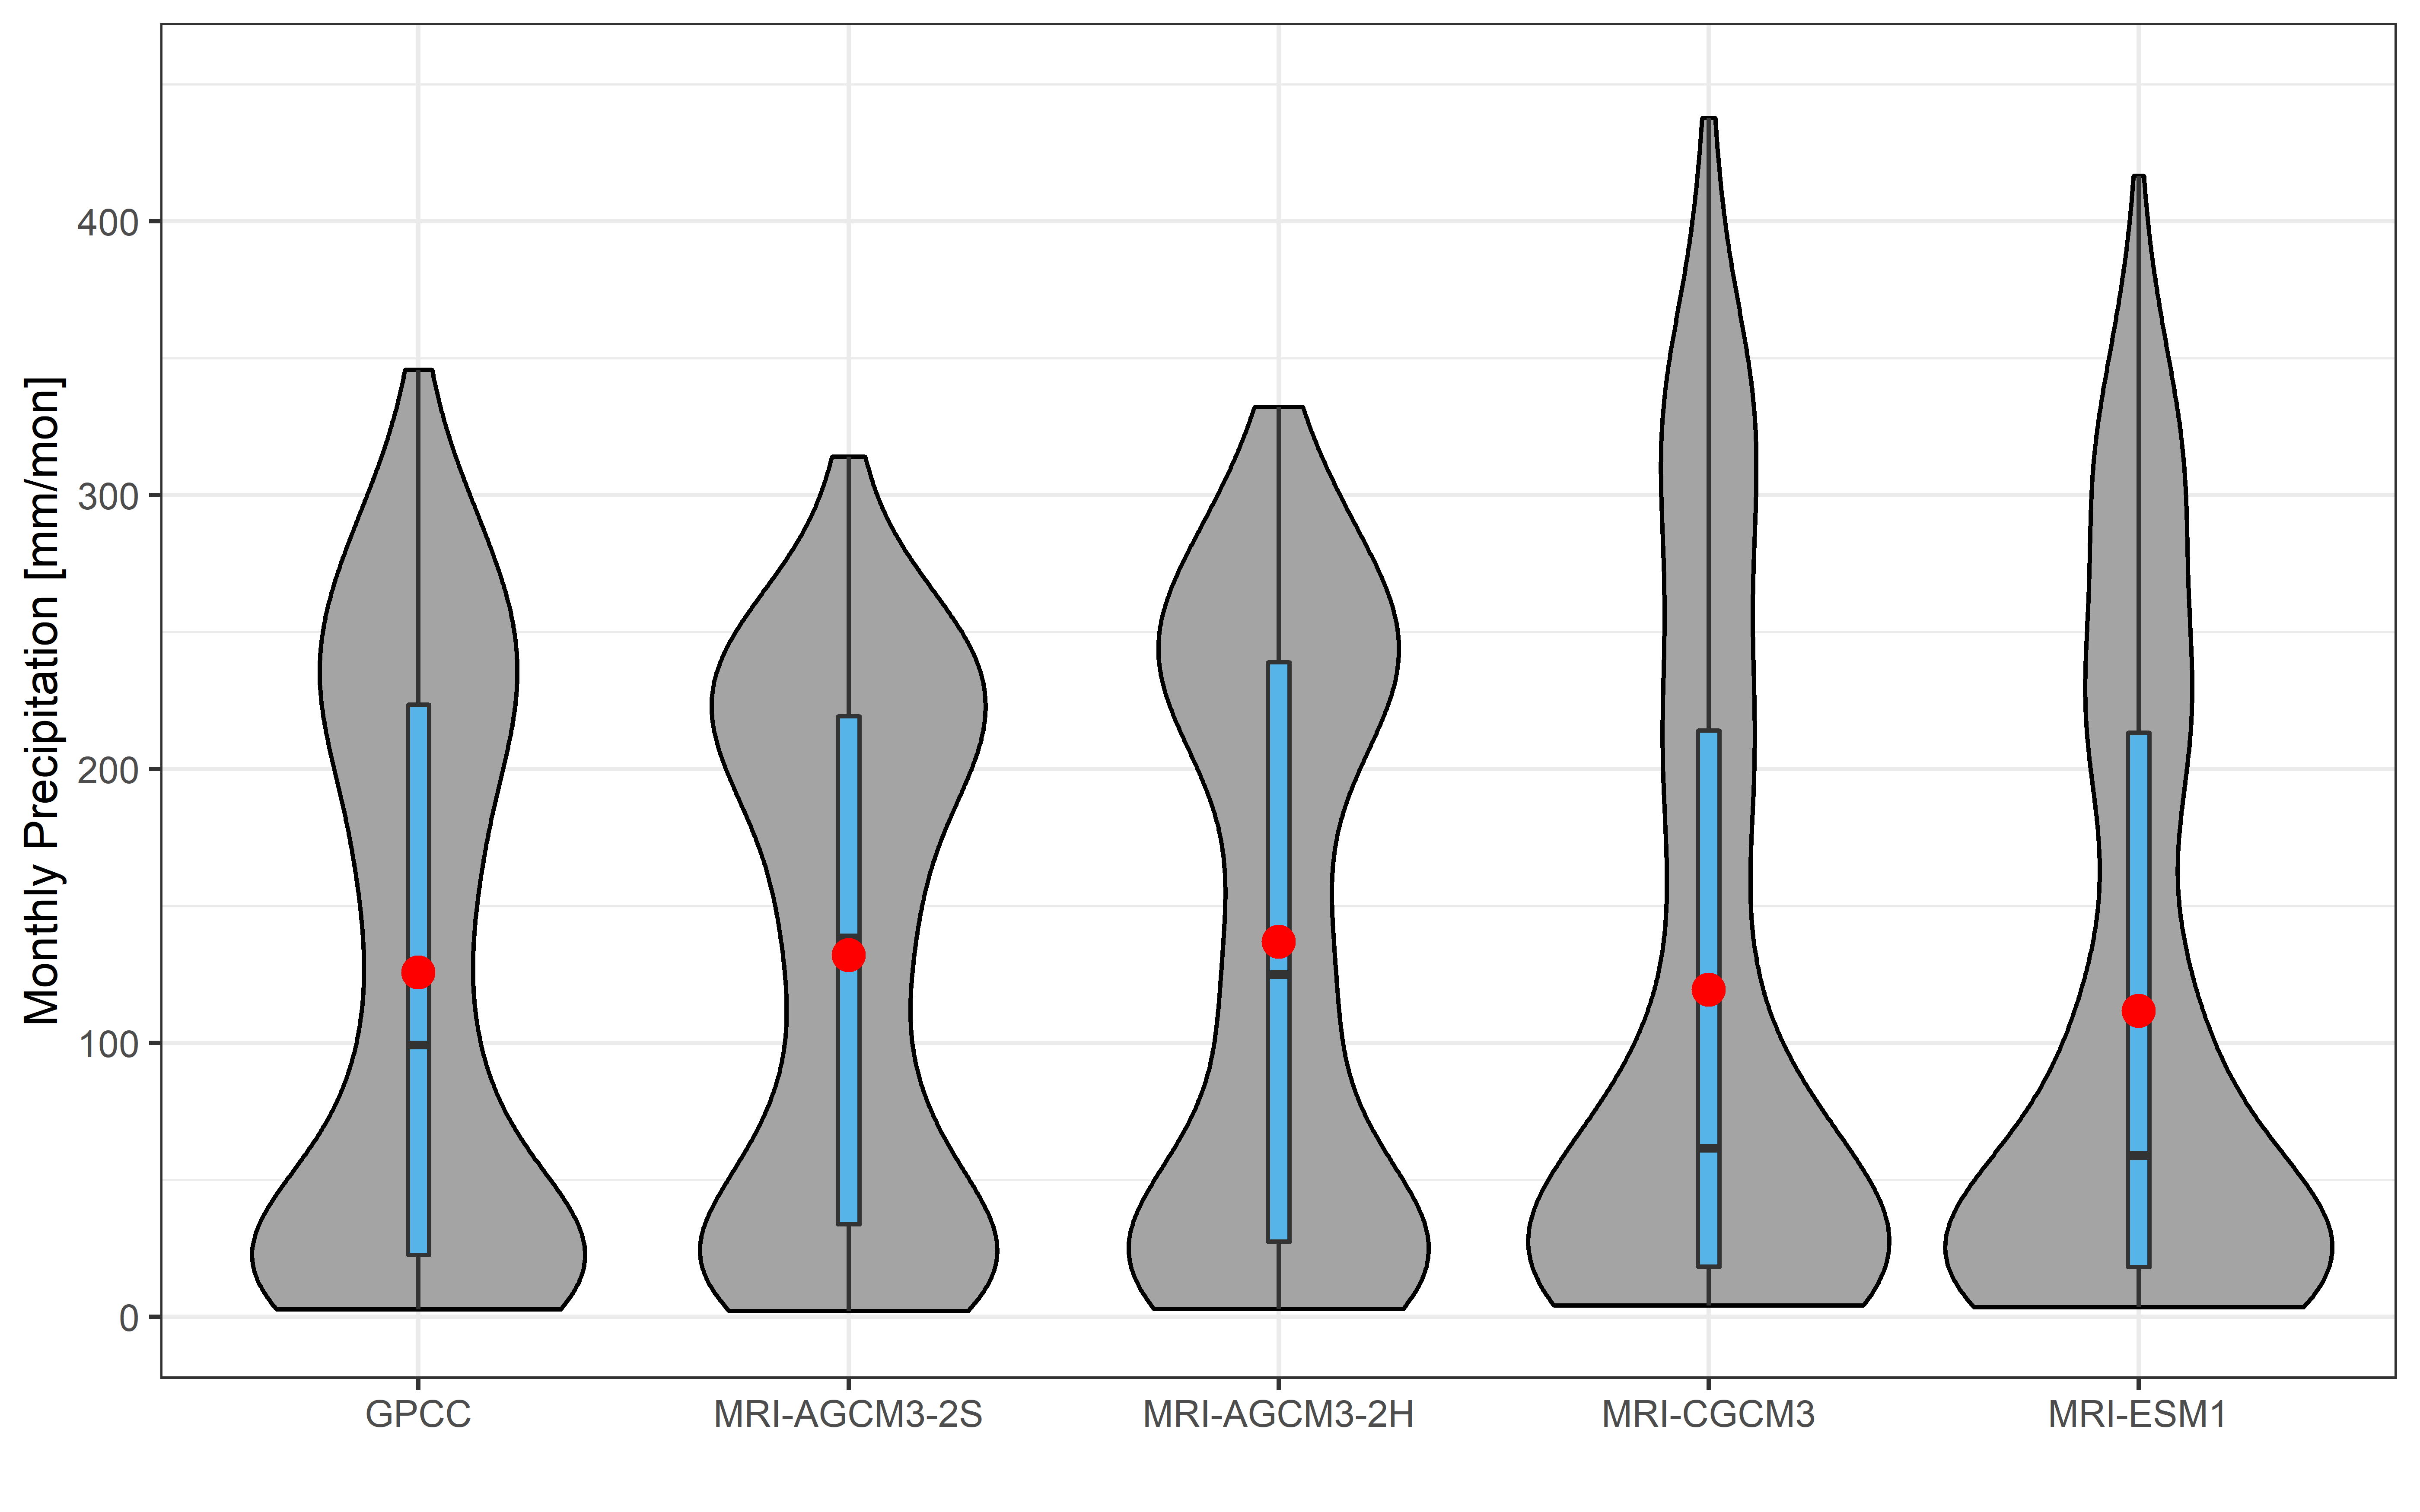
Here I will show how to plot bar chart with line graph to show monthly precipitation by different climate change scenarios with the code written in R.